




This MoMo Nigeria 2026 fintech metrics comparison starts with two figures. Core mobile money revenue rose 102.2% year on year, while total fintech revenue fell 25.9%. Both cover the nine months to 30 September. They tell different stories because they measure different parts of the business. MTN Nigeria’s 30 October earnings release, pp. 2 and 4
In August, MoMo PSB moved to Alipay+. That changed which users counted toward reported activity. At the end of Q3, MTN counted 3.2 million monthly active users on the new platform only. Before you compare this figure with older totals, check which users and events each series includes.
Core mobile money and total fintech cover different products
MTN reported ₦97.5 billion in total fintech revenue for the first nine months of 2026, down from ₦131.6 billion a year earlier. The category includes airtime and data credit. MTN paused that service from April to June, then resumed it under a model with multiple partners. The company reported that credit revenue rose 78.5% in Q3 versus Q2. That last figure applies to the credit service over one quarter.
Meanwhile, MTN attributed most of the core mobile money revenue growth to higher float income. The release reported wallet balances of ₦43.8 billion at the end of Q3, more than four times their December 2025 level. Wallet balances show how much customers held at a point in time. Float income is a revenue stream the company earns over a period.
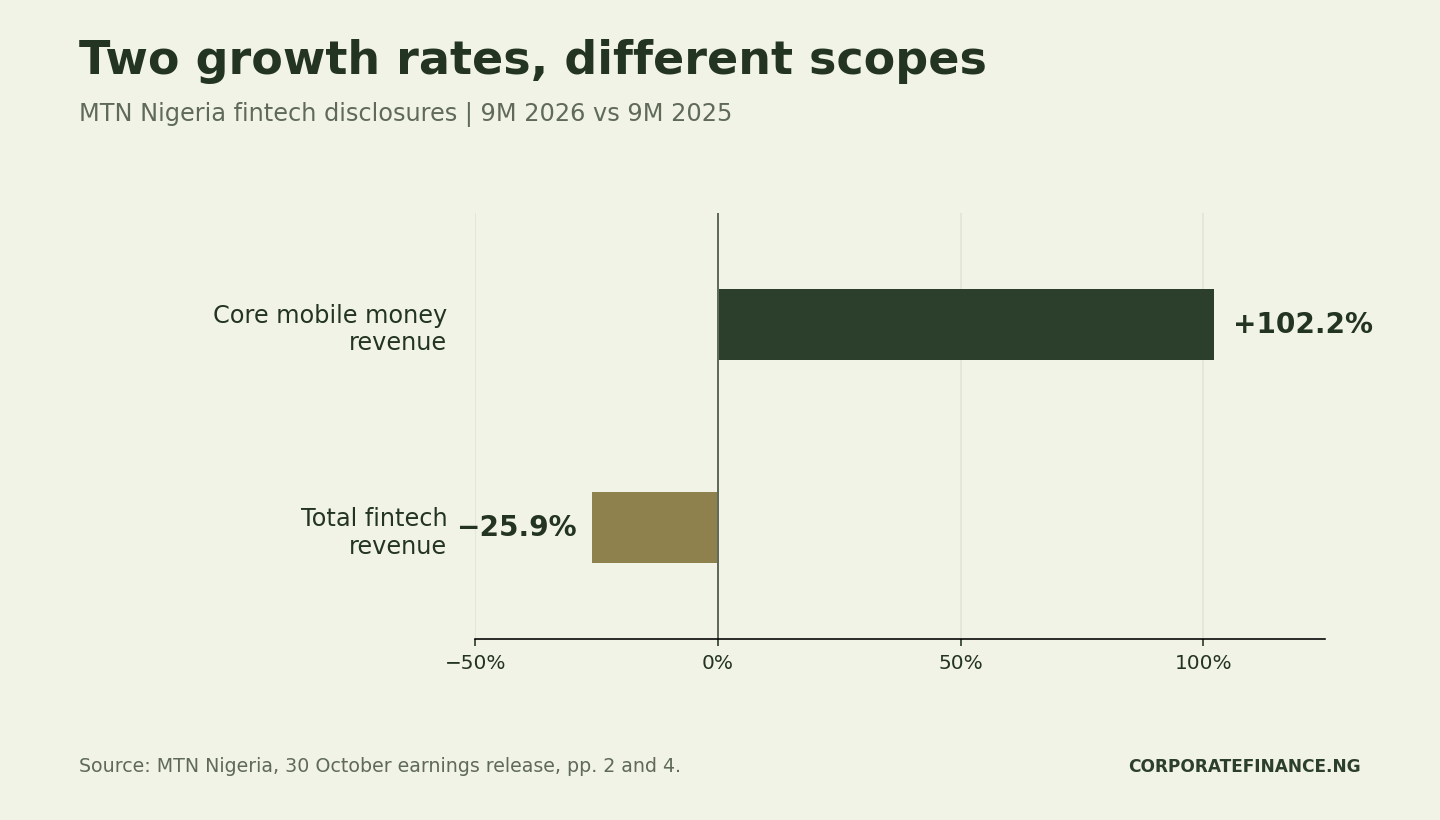
The two growth rates alone cannot show how much each product contributed to the overall change. To build that bridge, ask for the naira revenue by product in both periods. In addition, check that finance classified each product consistently.
Use the right clock for each MoMo metric
The revenue figures cover January through September. The volume comparison uses only Q3 and Q2. MTN said Q3 transaction volumes rose 69.1% from Q2. That supports a statement about sequential activity. To measure annual growth, you need a comparable Q3 2025 base.

Likewise, the ₦43.8 billion balance describes a single date. The 3.2 million count uses a month of activity and the new platform’s coverage. As a result, dividing the full wallet balance by 3.2 million does not give a reliable average balance per active user. You would first need wallet balances for that same user cohort, on the same date.
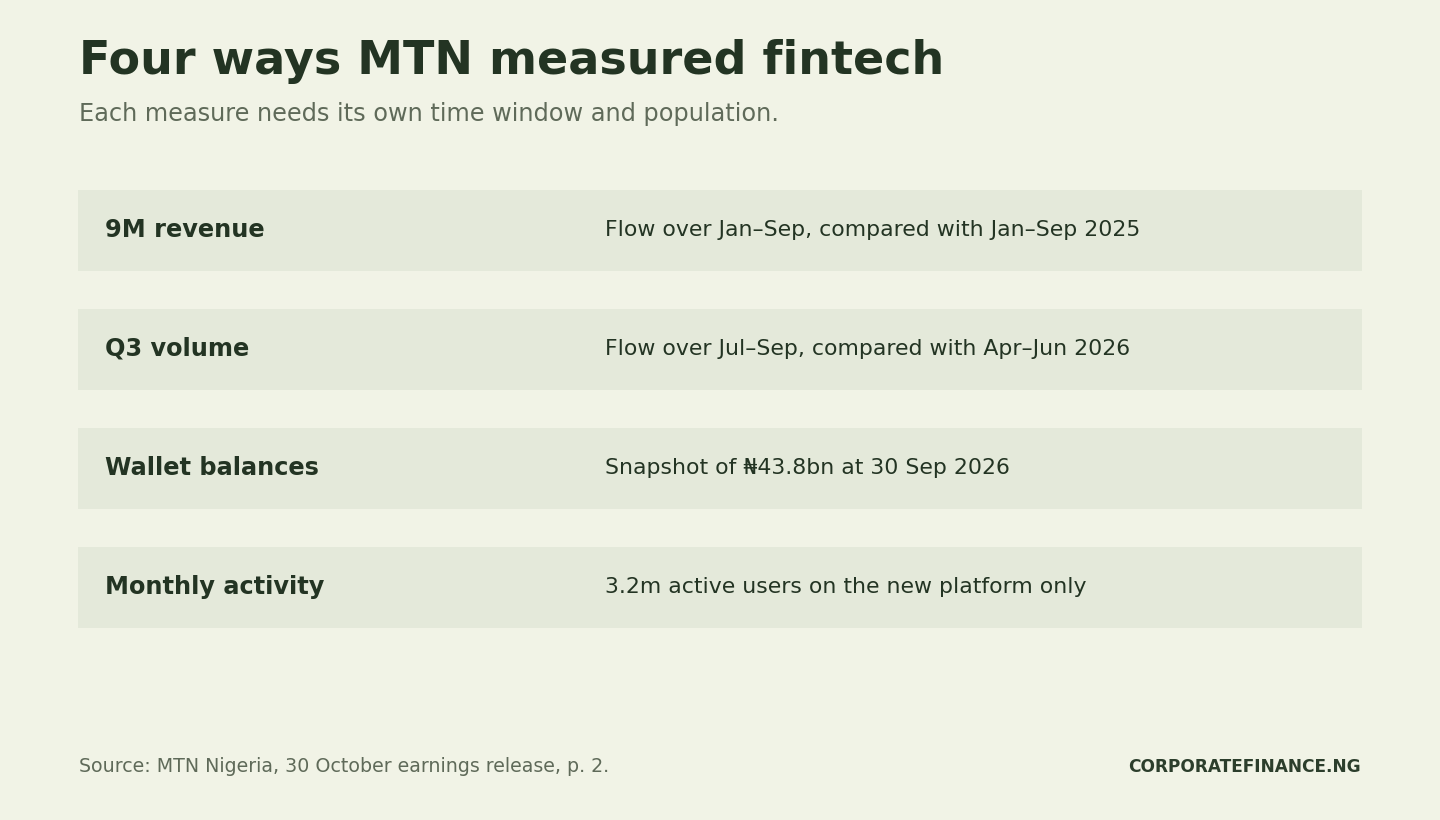
Use the MoMo metric dictionary (CSV) to record the unit, dates, platform scope and baseline of each number. The register also flags exclusions and points to the original disclosure.
A comparability test for finance teams
Start with the question the board wants answered. Then write down the product scope, the period, the unit and the set of users or wallets. For a per-user measure, decide whether the denominator should be an average over the period or a count at one date. Next, check that the numerator comes from that same population.
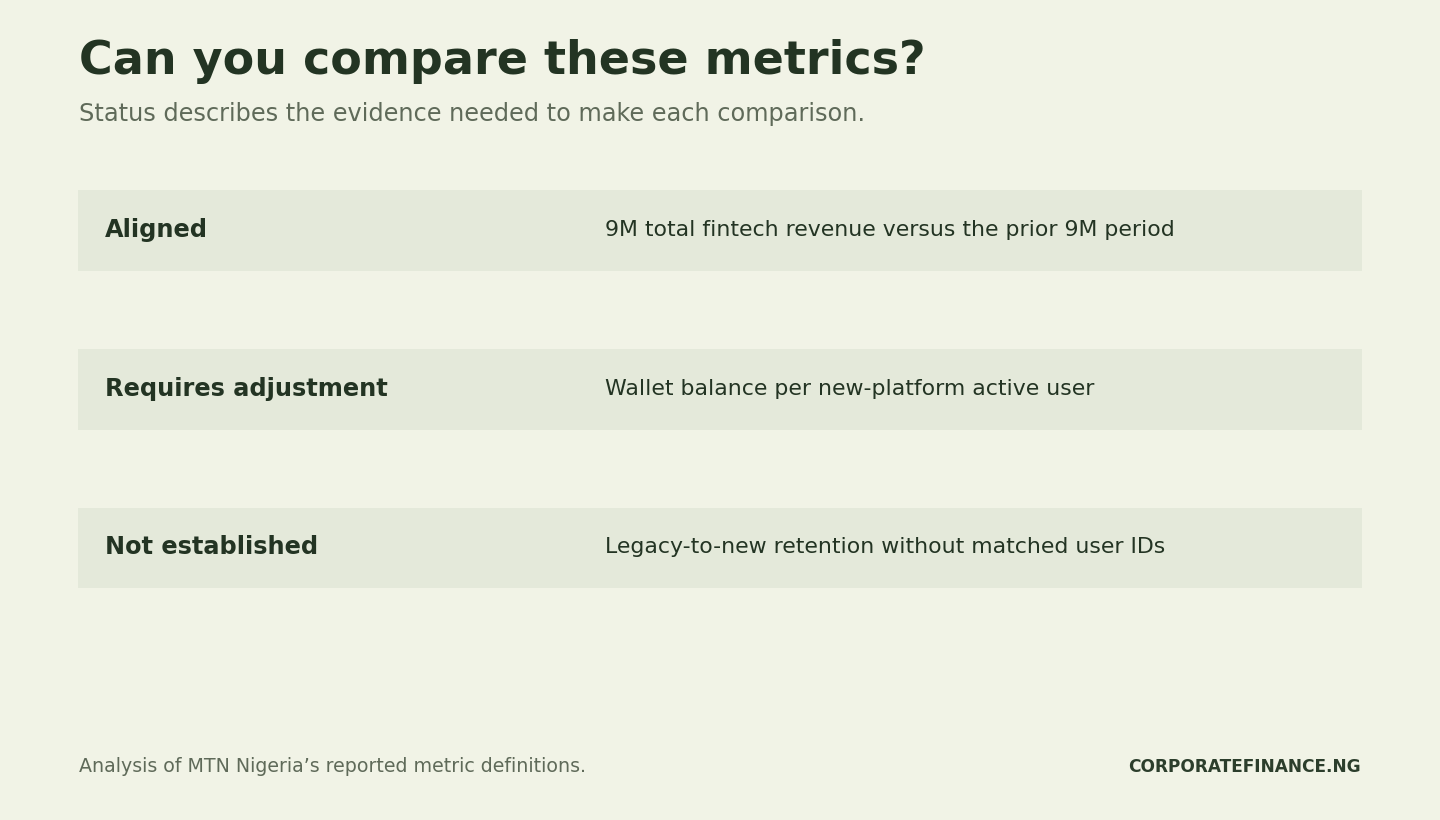
| Proposed comparison | Assessment | Reason |
|---|---|---|
| Total fintech revenue, 9M 2026 versus 9M 2025 | Aligned | Use the reported category and nine-month dates. Credit-service interruption still matters when explaining the change. |
| 9M core mobile money growth versus 9M total fintech growth | Requires adjustment | The time window matches. To isolate product contributions, get revenue amounts for each component in both periods. |
| Q3 versus Q2 transactions | Aligned for the reported sequential change | Keep the comparison quarterly. Confirm platform coverage and event rules before attributing the change to migration. |
| End-Q3 wallet balances per new-platform active user | Requires adjustment | Obtain end-Q3 balances limited to the active new-platform cohort. |
| Legacy-to-new customer retention | Not established | Identify the same customers on both platforms and apply the same activity rules. |
The comparability matrix (CSV) records these decisions and the specific evidence that would change them. For a related example of how accounting definitions alter a reconciliation, see the MTN cash tax reconciliation.
Reconcile customer cohorts across the August migration
Freeze the legacy extract at a defined cut-off. Then link IDs from each system through a controlled crosswalk. First, assign each legacy customer to either migrated or unmigrated. Next, count genuinely new customers separately. Deduplicate identities before you total the cohorts. Finally, apply a consistent activity rule to both windows and record inactive accounts as a separate flag within each cohort.
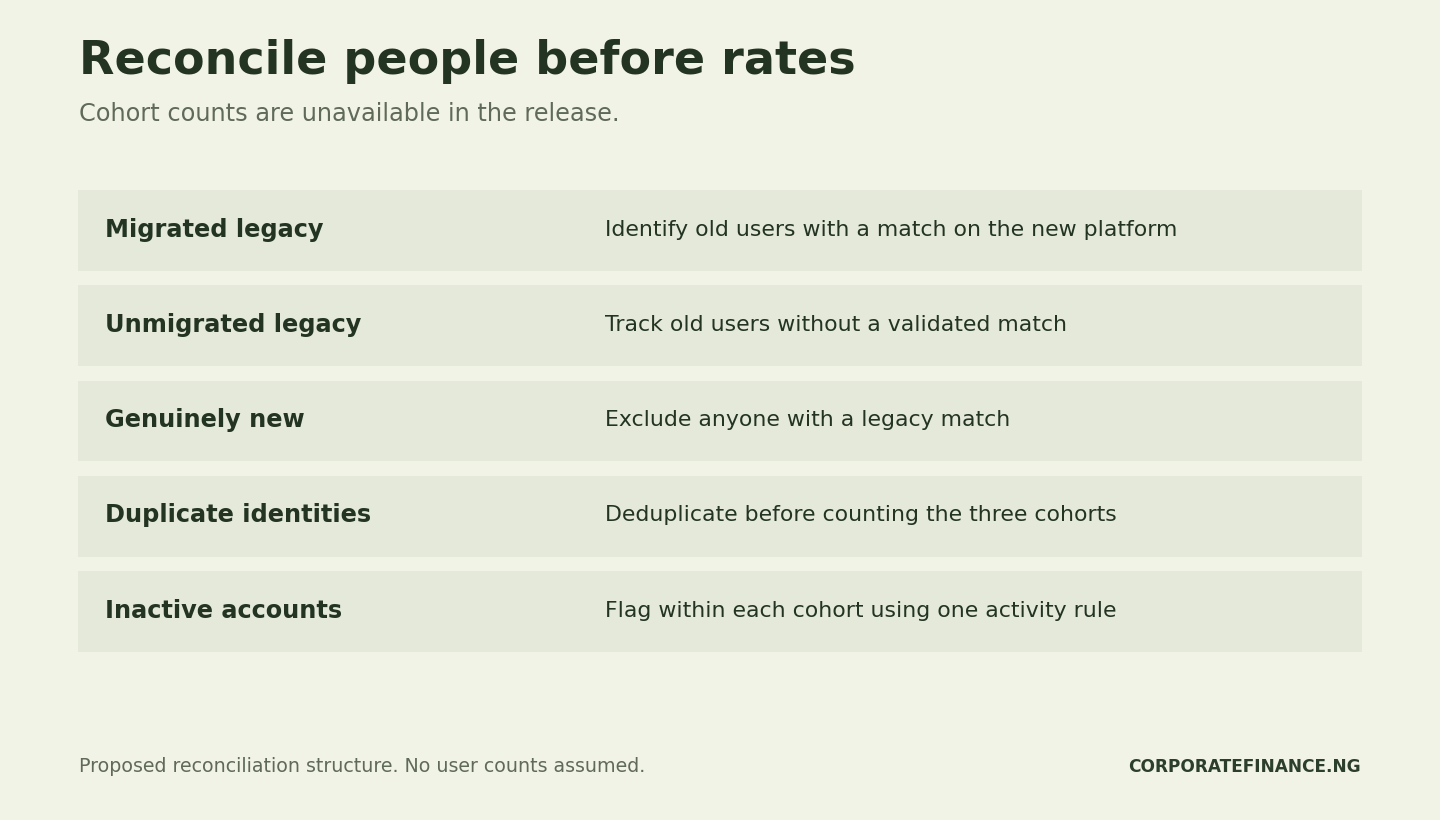
For example, a customer may migrate in August and make no qualifying transaction in September. Count that customer once in the migrated cohort. Their September activity flag is inactive. This distinction helps a team separate migration completion from retention.
The blank migration reconciliation (CSV) leaves the counts empty. A blank means the evidence has yet to arrive. Record an explicit zero only after a validated extract confirms it. Also document how the team treats failed, reversed or duplicate events. Assign a reviewer to approve both the identity match and the activity logic. See the automated financial controls guide for a related control design.
Mark the reporting break on the dashboard
A dashboard can show the two series side by side, each with its own scope label. To make the cutover visible, label August as the migration month and leave a gap between the series. Under each panel, state which platform and activity rule it uses.
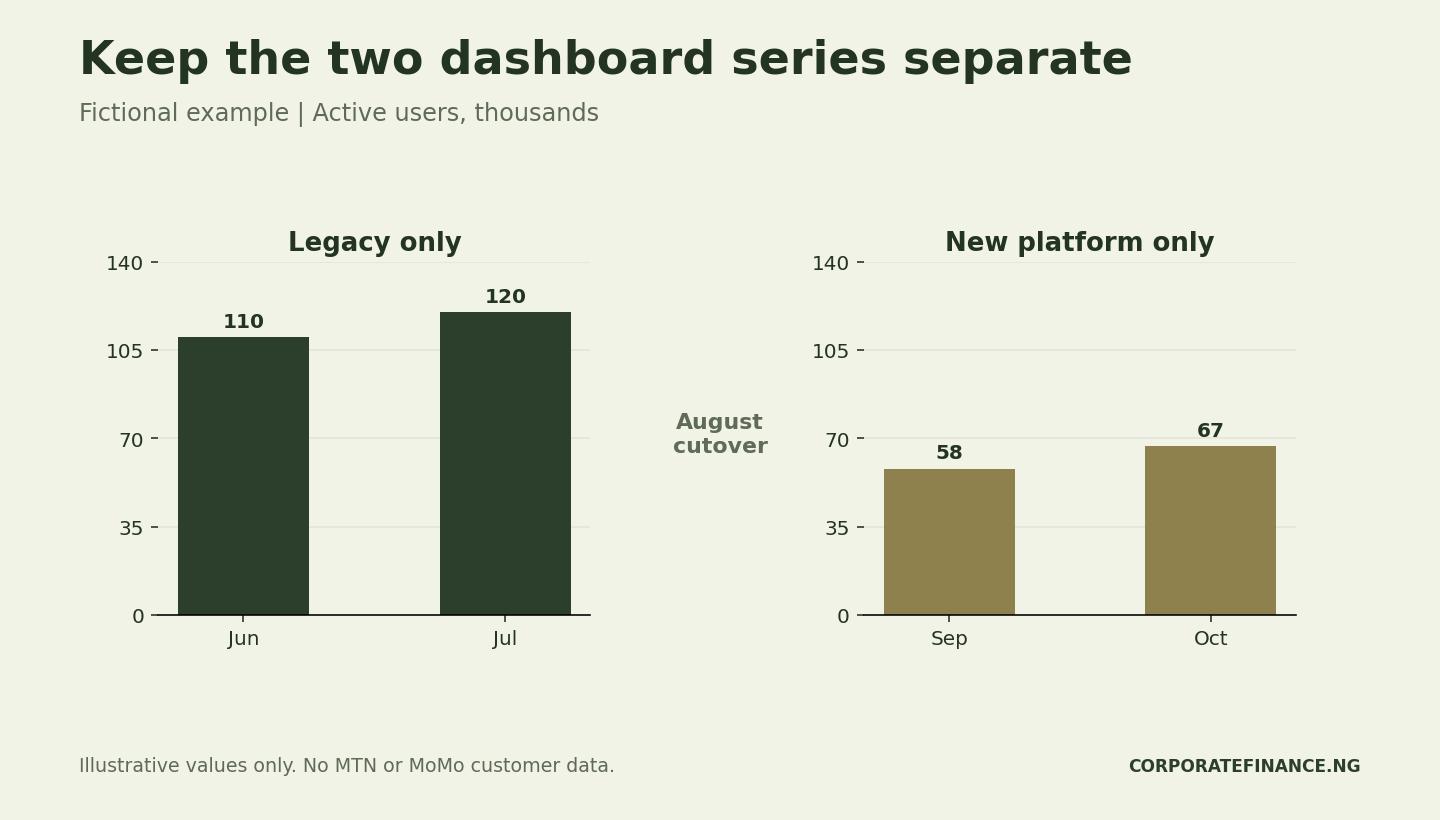
The fictional dashboard inputs (CSV) show how to label each series. If the team later validates a matched bridge, add a separately labelled comparable series. Keep the figures originally reported visible so readers can reconcile the change.
What the MoMo Nigeria 2026 fintech metrics comparison can show
The earnings release gives a nine-month revenue comparison, a sequential volume change and a new-platform activity snapshot. It does not supply matched cohorts, detailed revenue allocation or the platform coverage needed to isolate a migration effect. So the available data cannot establish retention, migration success or product profitability.
For the next board pack, give each metric a definition owner. Ask the owner to document the scope and dates, reconcile identities where needed, and sign off any adjustment before publishing a new growth rate.


