





Fidelity Bank growth rate analysis should begin with the reporting periods and units. The bank’s 19 November 2026 handover notice presents several 2020-to-2025 comparisons. We reproduce the arithmetic while separating annual profit, balance-sheet stocks and a return ratio. A correct formula does not, by itself, explain what caused a result.
Fidelity Bank growth rate analysis: check the original endpoints
The issuer notice filed with NGX reports profit before tax rising from ₦28.1 billion to ₦347.7 billion. Customer deposits move from ₦1.699 trillion to ₦6.891 trillion, while net loans and advances move from ₦1.326 trillion to ₦4.282 trillion. Its RoAE comparison is 10.5% versus 24.4%.
These are the notice’s rounded endpoints, not a new extraction of every annual account. We visually checked the original PDF figures before calculating. Keep the unit alongside each input: billions and trillions can look similar in a compact table but differ by a factor of one thousand.
Count five annual intervals between 2020 and 2025
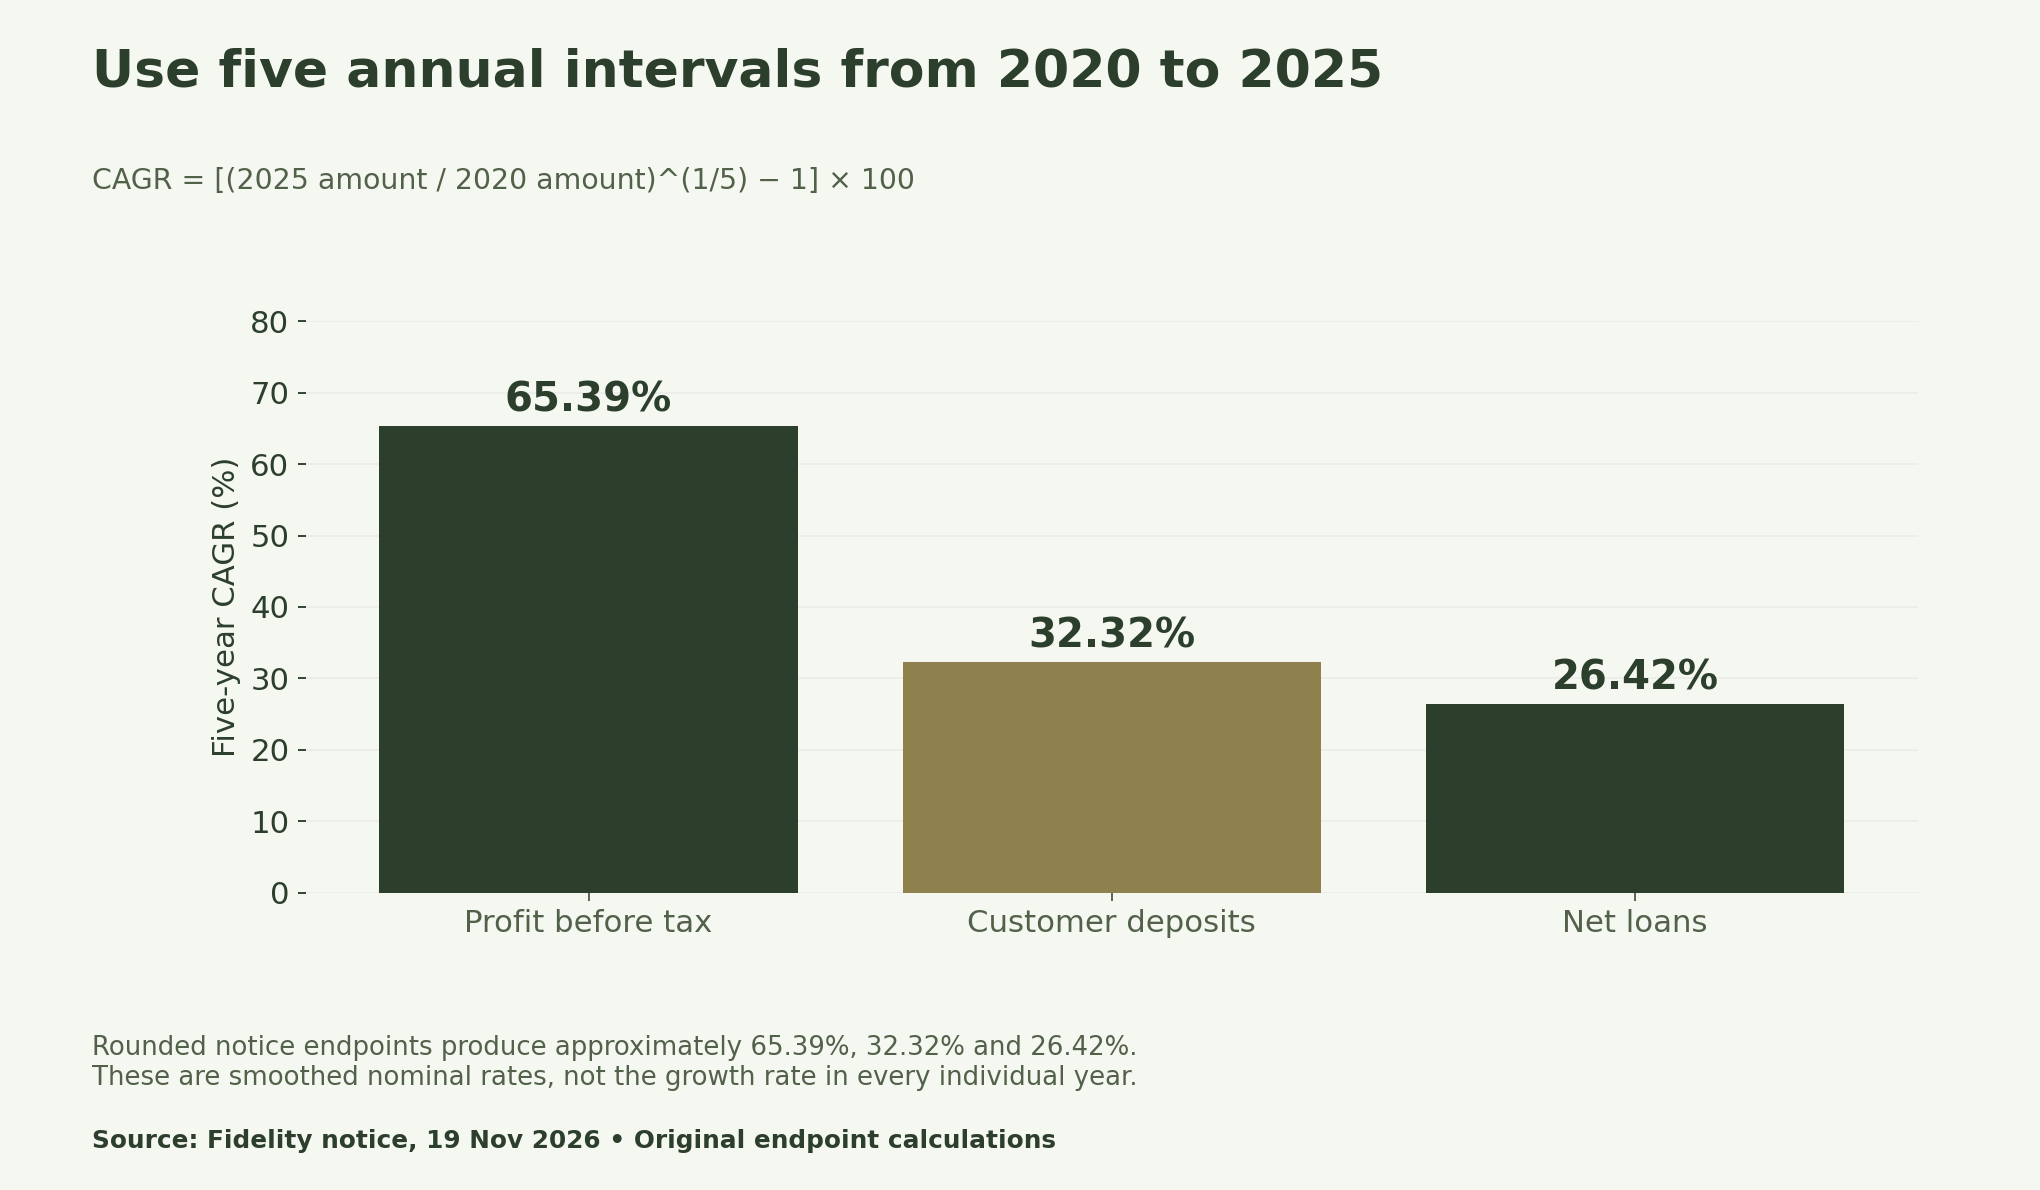
The compound annual growth rate is the ending amount divided by the starting amount, raised to one fifth, minus one. Multiply by one hundred to express it as a percentage. There are five annual intervals between the two dates, even though the inclusive list of calendar years contains six labels.
For PBT, the calculation is (347.7 / 28.1)^(1/5) − 1. It produces approximately 65.39%. Applying the same formula to deposits and net loans gives approximately 32.32% and 26.42%. Small differences from a calculation based on unrounded accounts would not necessarily indicate a reporting error.
Use an index to compare scale, not absolute size
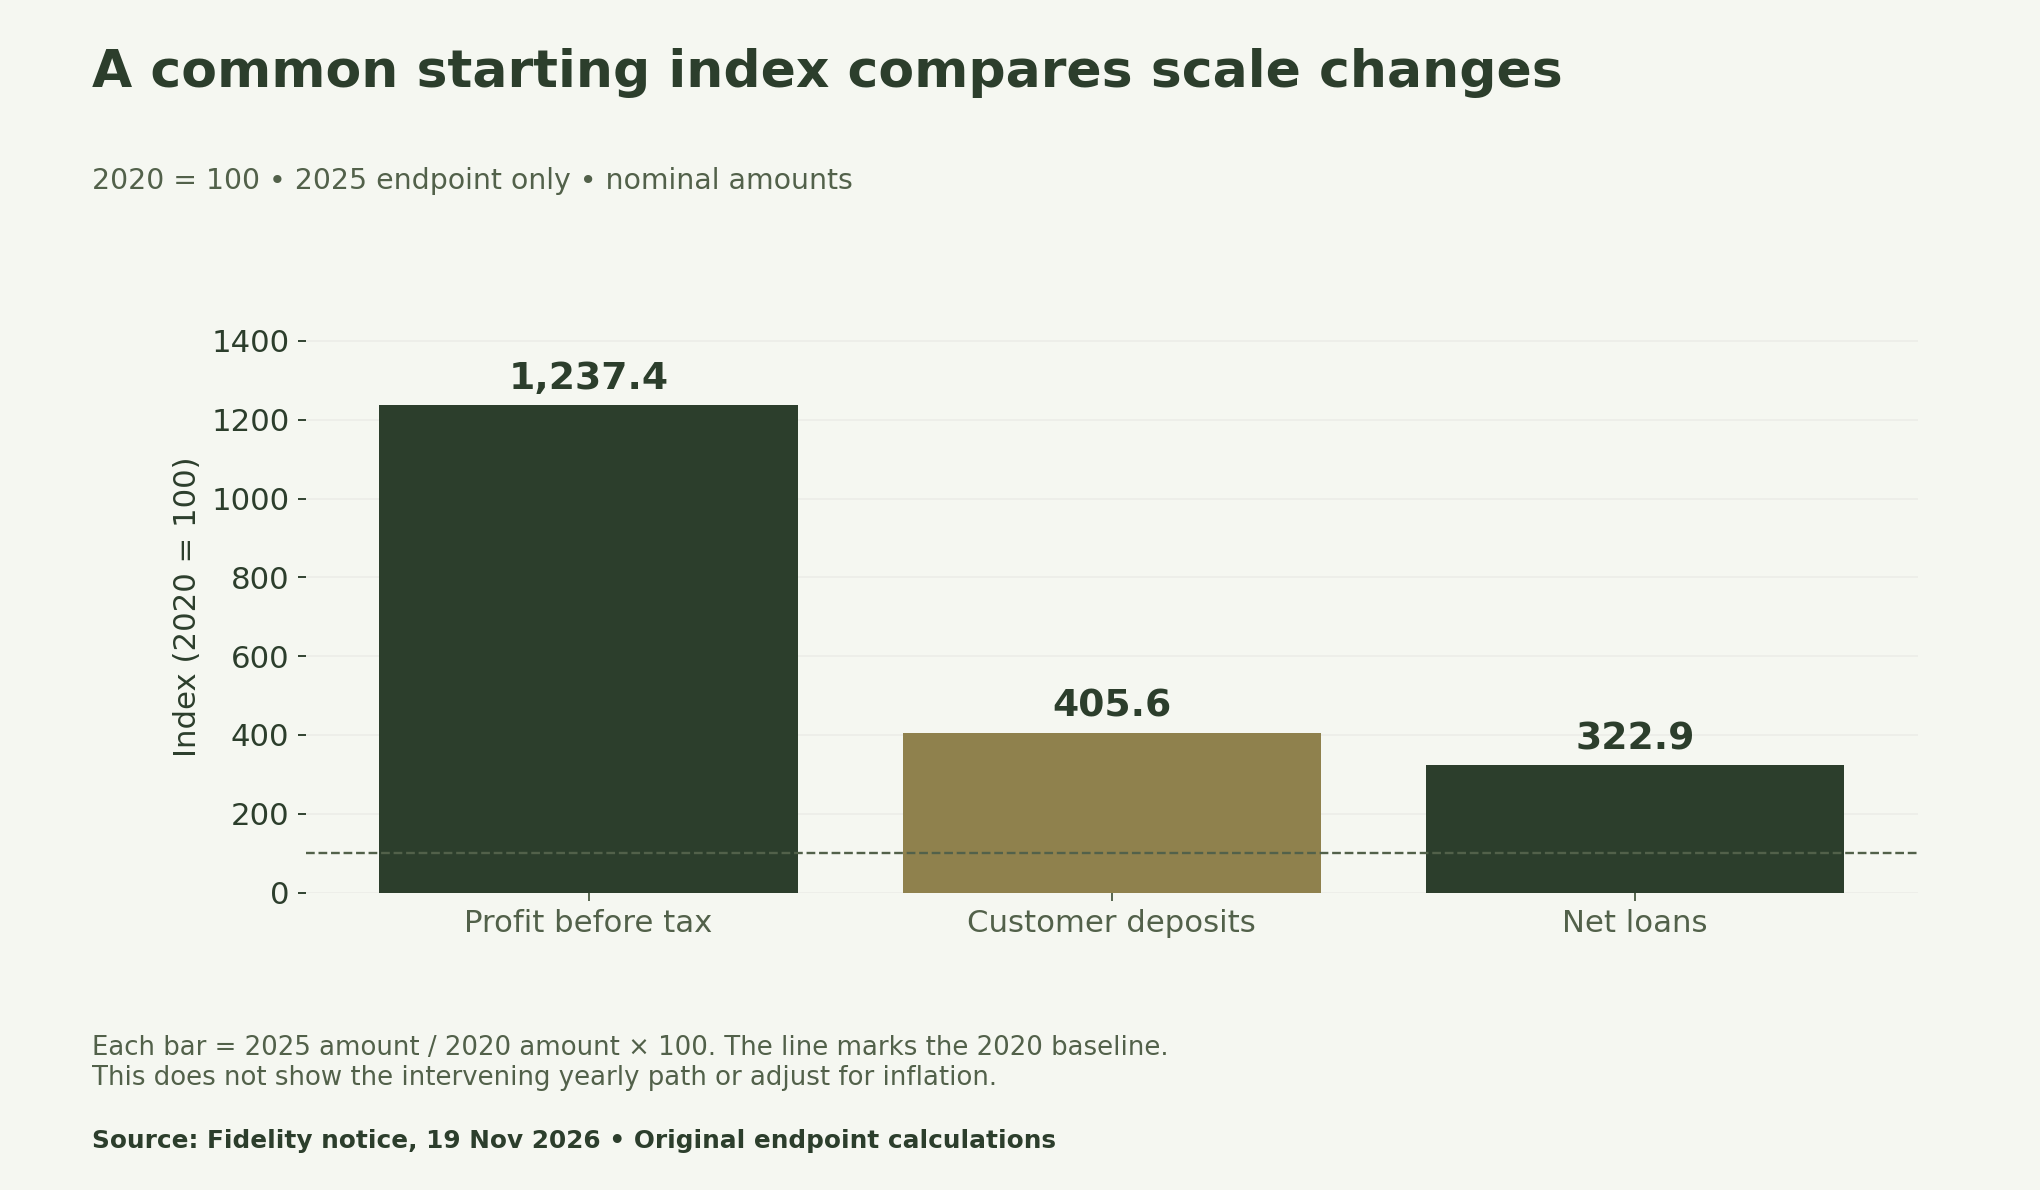
The indexed chart divides each 2025 endpoint by its own 2020 starting value and multiplies by one hundred. This makes relative scale changes visible without placing profit in billions next to deposits in trillions on an ambiguous axis. It should never be labelled as a comparison of absolute bank balances.
We show terminal bars rather than draw a smooth line through unobserved years. A straight or curved line between endpoints can imply a path that the data do not supply. Add annual points only after checking their source, scope and time basis.
Keep the RoAE change in percentage points
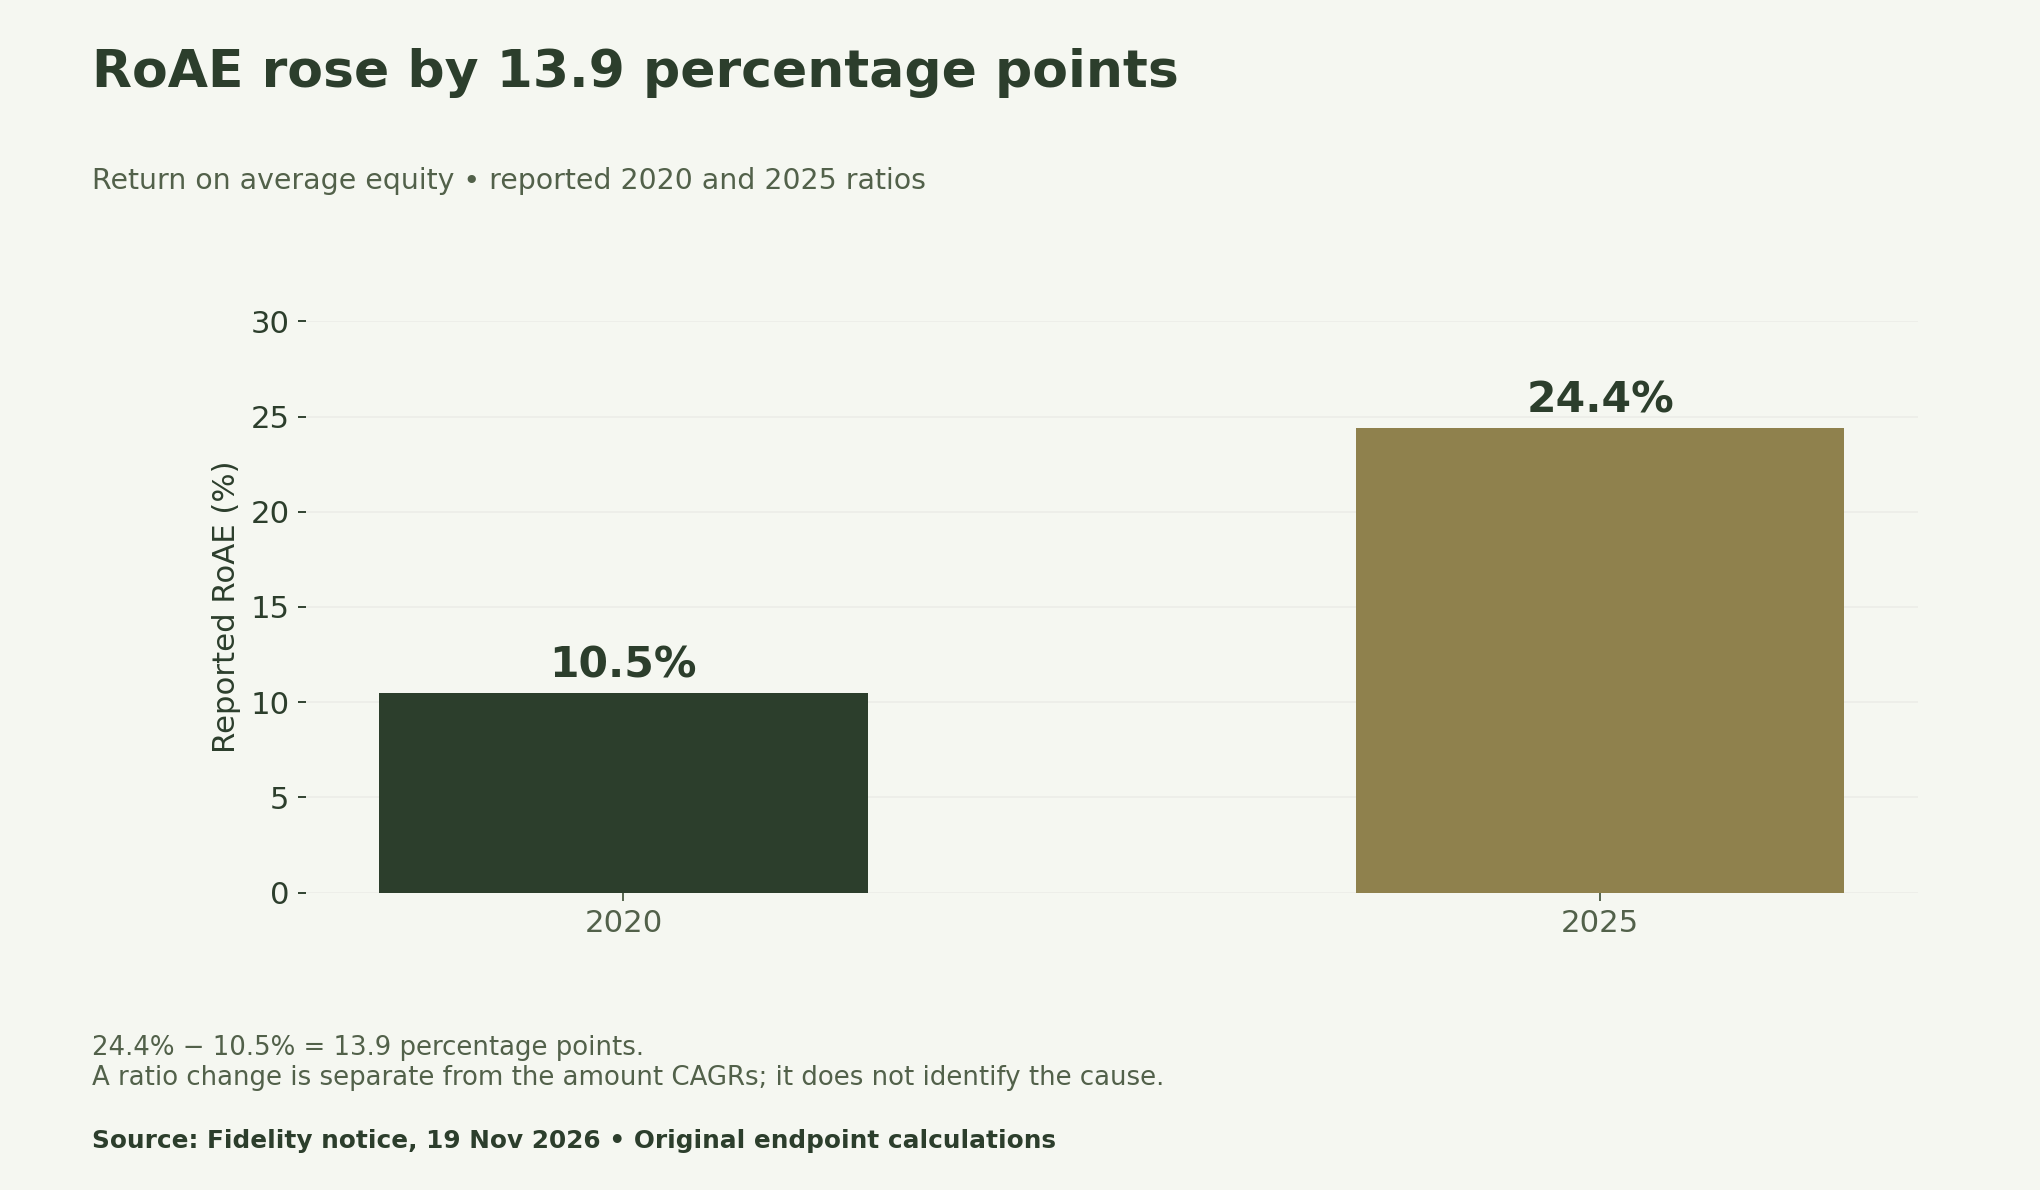
Subtracting 10.5 from 24.4 gives 13.9 percentage points. Calling this a 13.9% relative increase would mean something different. Also, the ratio’s movement cannot be understood fully without examining the profit numerator and average-equity denominator used in the underlying accounts.
Separate flows, stocks and ratios in the reporting pack
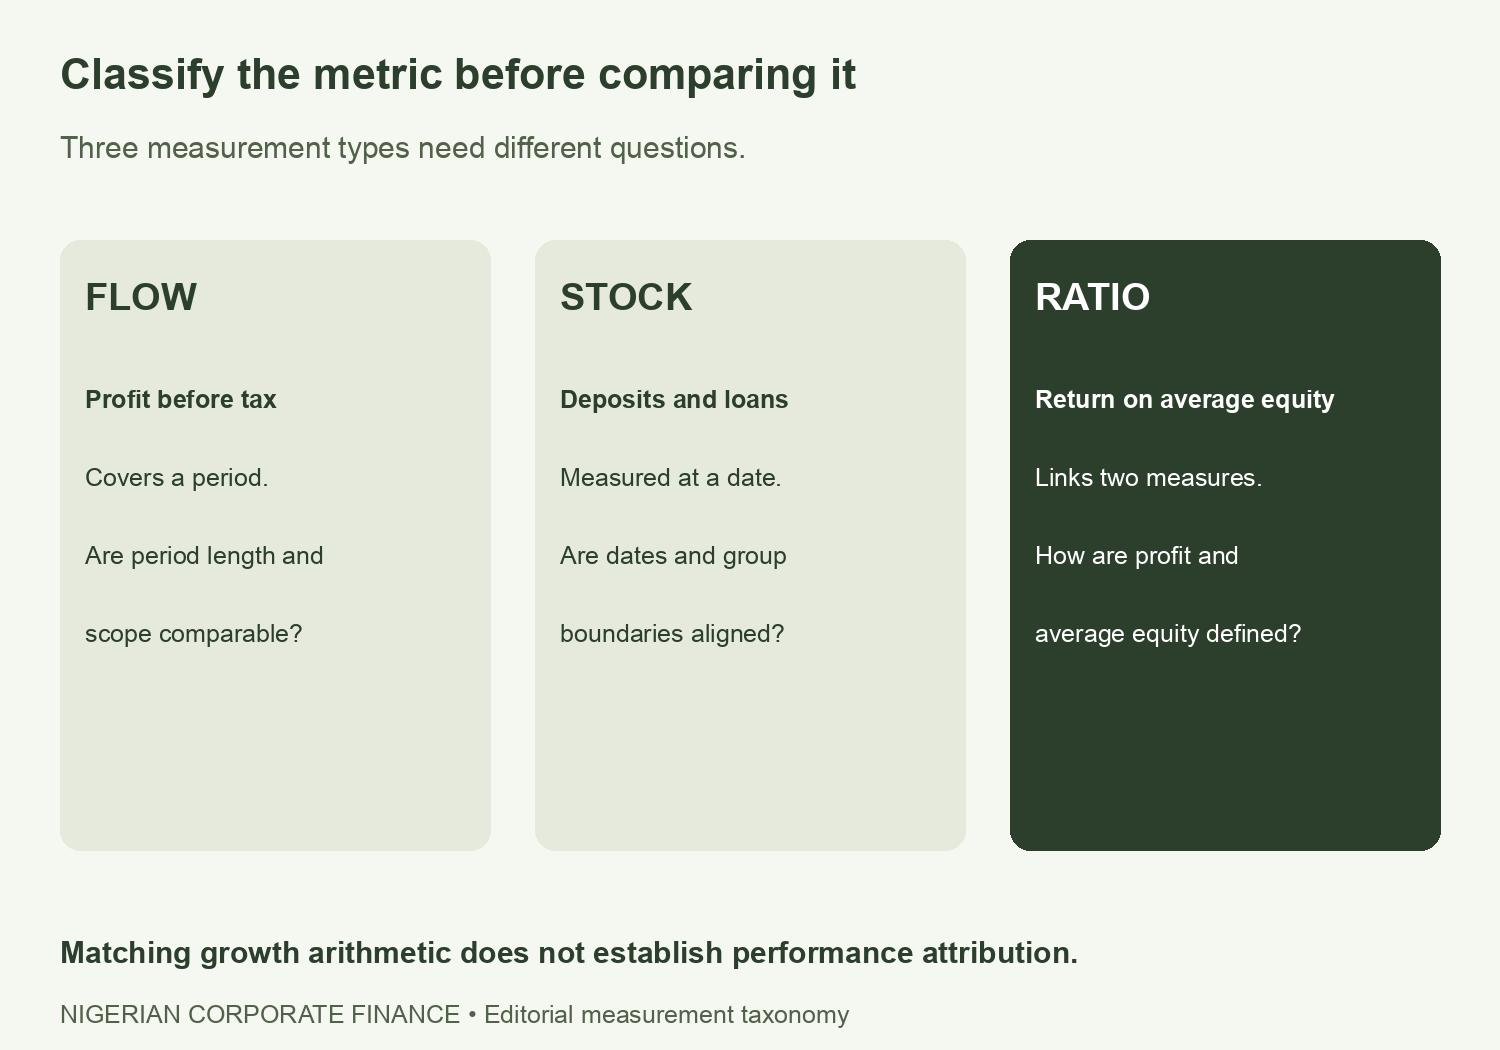
Profit before tax is an amount earned over a period. Deposits and net loans are balances measured at a date. RoAE relates one measure to another. A reporting pack should identify those differences before placing the metrics into a common narrative or dashboard.
For example, comparing a nine-month flow with a full-year flow changes the question. Likewise, mixing a group balance with a bank-only balance may introduce a scope difference. This article reproduces the notice’s endpoint comparison; it does not certify that all account definitions stayed unchanged throughout the interval.
Nominal growth is not inflation-adjusted growth
The calculations use reported naira amounts without adjusting for changes in purchasing power. A real-growth analysis needs an appropriate price measure, a defined method and aligned dates. Do not relabel nominal CAGR as real growth or silently deduct an unrelated single inflation reading.
An analyst should also examine changes in consolidation, capital, business mix and accounting measures when interpreting a long interval. The endpoint formula cannot separate those influences. A list of possible explanations is a research agenda, not proof that any one factor caused the growth.
What the handover context can and cannot establish
The notice places the metrics in an executive-succession announcement. That context explains why the numbers are presented together. It does not turn our arithmetic check into an independent attribution study, an audit opinion or a forecast for the incoming leadership team.
Keep the conclusion proportional: the selected rounded endpoints support the reproduced rates. To investigate performance quality, obtain the relevant annual accounts, notes and consistent definitions. To make an investment decision, much more evidence would be needed than the three growth rates shown here.
Download the endpoint and formula checks
- Reported handover endpoints and units (CSV)
- Reproducible five-year CAGR and index calculations (CSV)
- RoAE percentage-point calculation (CSV)
- Metric types and comparability review dictionary (CSV)
Methodology and limits
We checked the original NGX-filed notice on 20 November 2026 and used its rounded 2020 and 2025 endpoints. Calculations retain full machine precision before chart rounding. The formula uses five intervals. We show three substantive charts because amount growth, indexed scale and the reported ratio answer different questions.
See our UAC disclosure-reconciliation guide for a related example of checking dates and accounting boundaries. This Fidelity Bank growth rate analysis is educational and is not an audit of the bank’s accounts, a claim about individual leadership effects or a stock recommendation.


