





JULI Q3 2026 overhead analysis starts with a classification question. A lower administrative total is visible in the filing, but that alone does not establish an operating-efficiency gain. Before turning the decrease into a performance claim, preserve the original labels and test what the comparison includes.
The NGX disclosure index lists the latest retrieved JULI Q3 filing on 11 November 2026. The document itself bears a 30 October date. Its PDF page 5 presents January–September columns for 2026 and 2025. Publication date, document date and accounting period therefore describe different things.
JULI Q3 2026 overhead analysis: reproduce the displayed total
Under ADMIN. EXPENSES on PDF page 5, the displayed total is 107,887,003.46 for 2026 and 182,068,034.87 for 2025. Using those values without changing their presentation, the reduction is 74,181,031.41. Dividing that reduction by the 2025 total gives 40.74% after rounding.
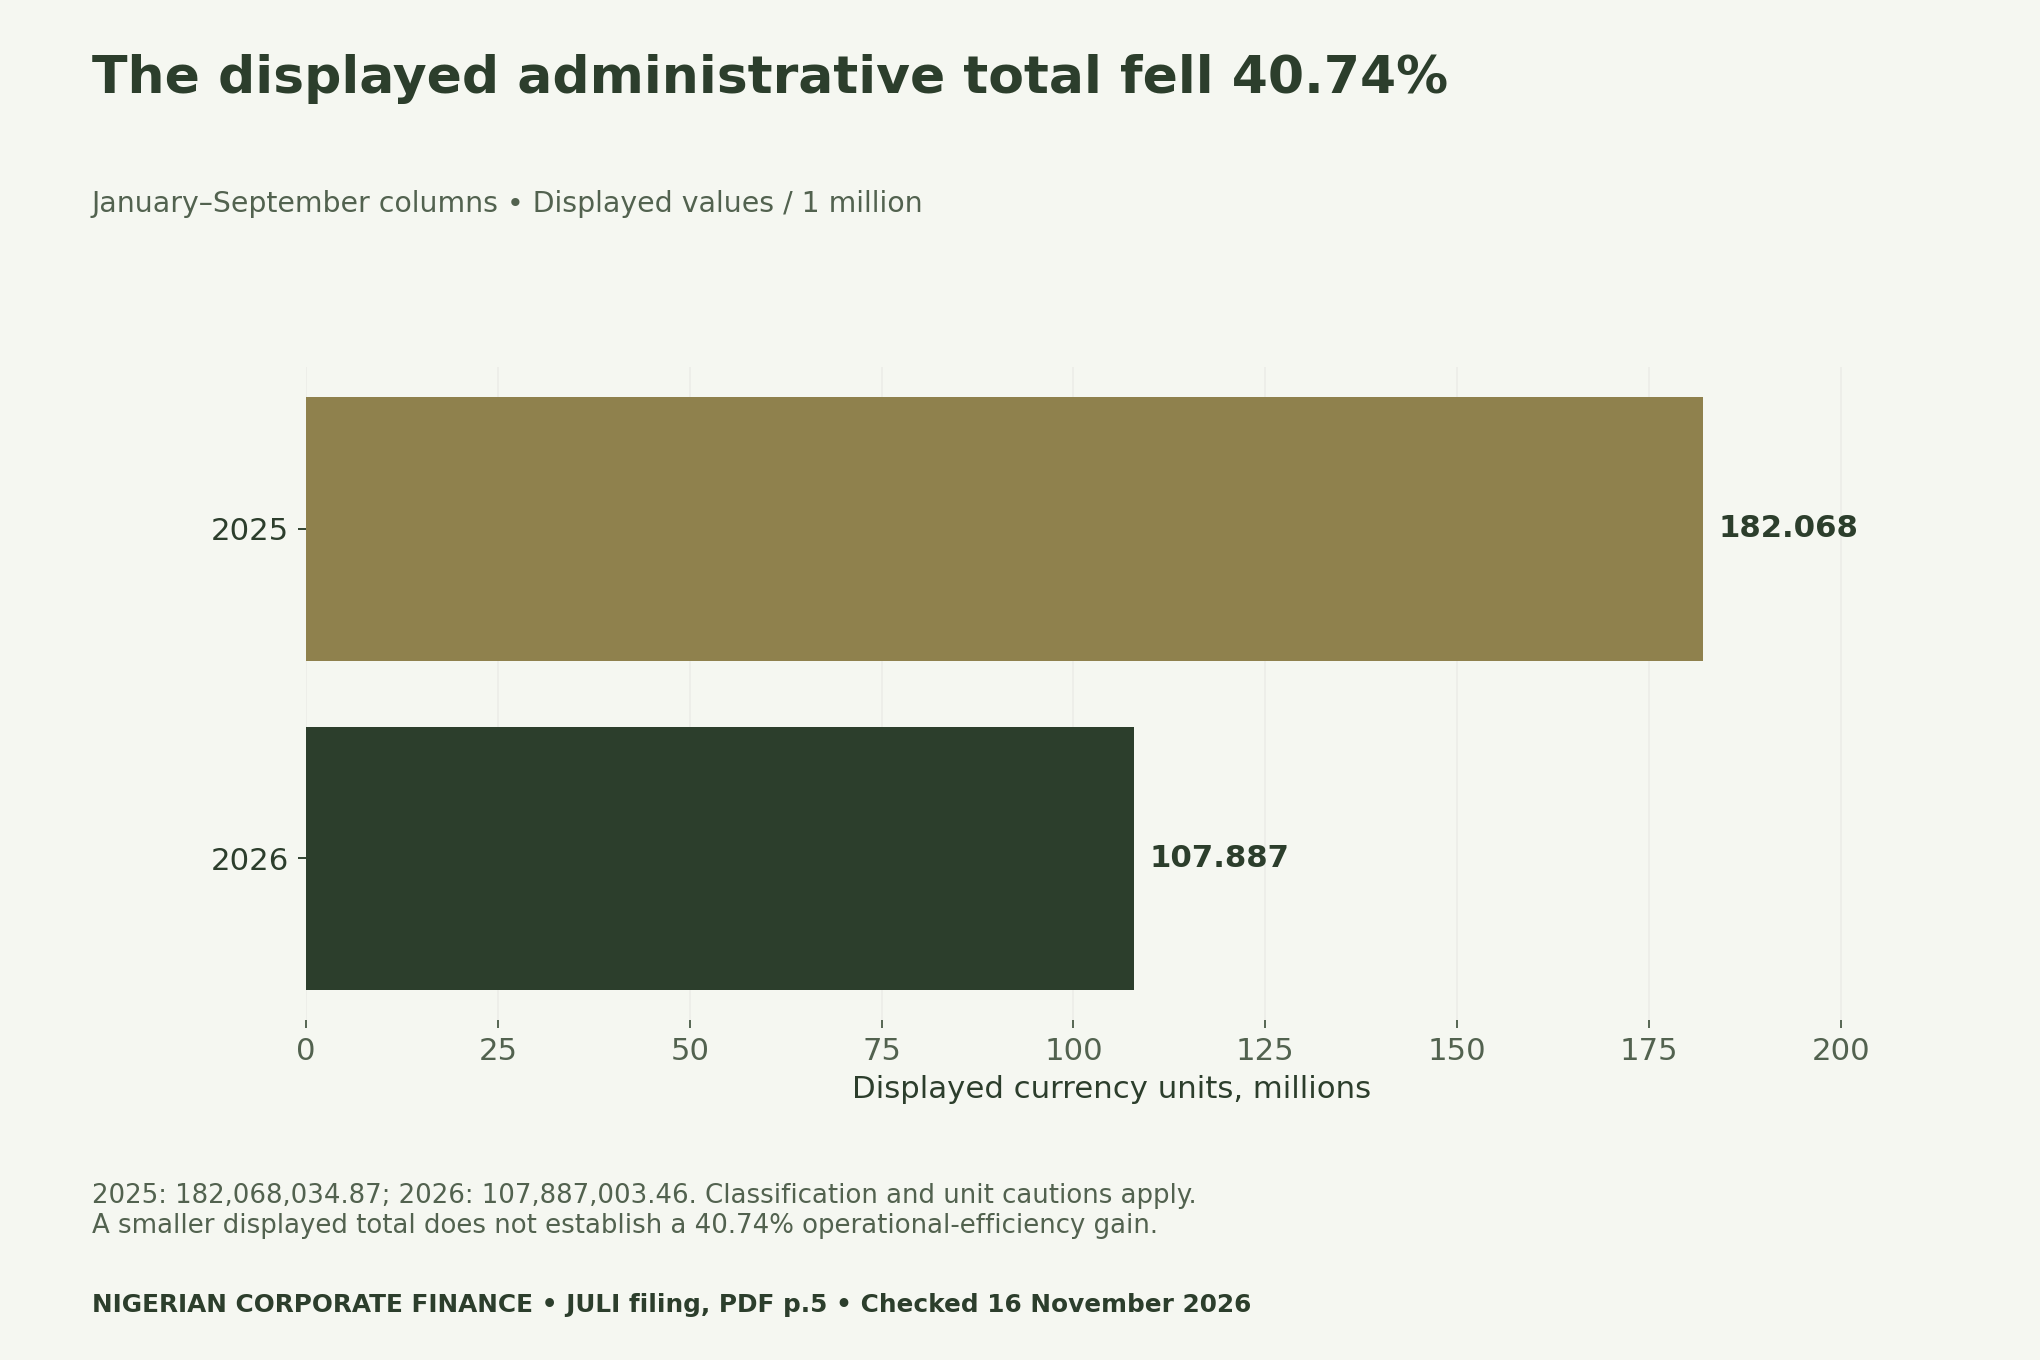
The working currency reading is naira, consistent with the surrounding statements, but page 5 does not print an explicit unit beside these columns. Other pages contain inconsistent period or unit labels. The source-cell register preserves that caveat. Do not silently apply a thousands multiplier from a different note or combine unlike periods.
A percentage calculated from two same-scale displayed values is straightforward arithmetic. Calling it a sustainable cost improvement is a further interpretation. That interpretation needs evidence about which items are operating expenses, whether their periods match and whether the comparison contains unusual amounts.
Inspect the Wema/CBN Loan Repayment label
The same page includes a line labelled “Wema/CBN Loan Repayment”: 6,000,000 in 2026 and 70,000,000 in 2025. Its displayed decrease is 64,000,000. That is 86.28% of the total administrative reduction when divided by 74,181,031.41.
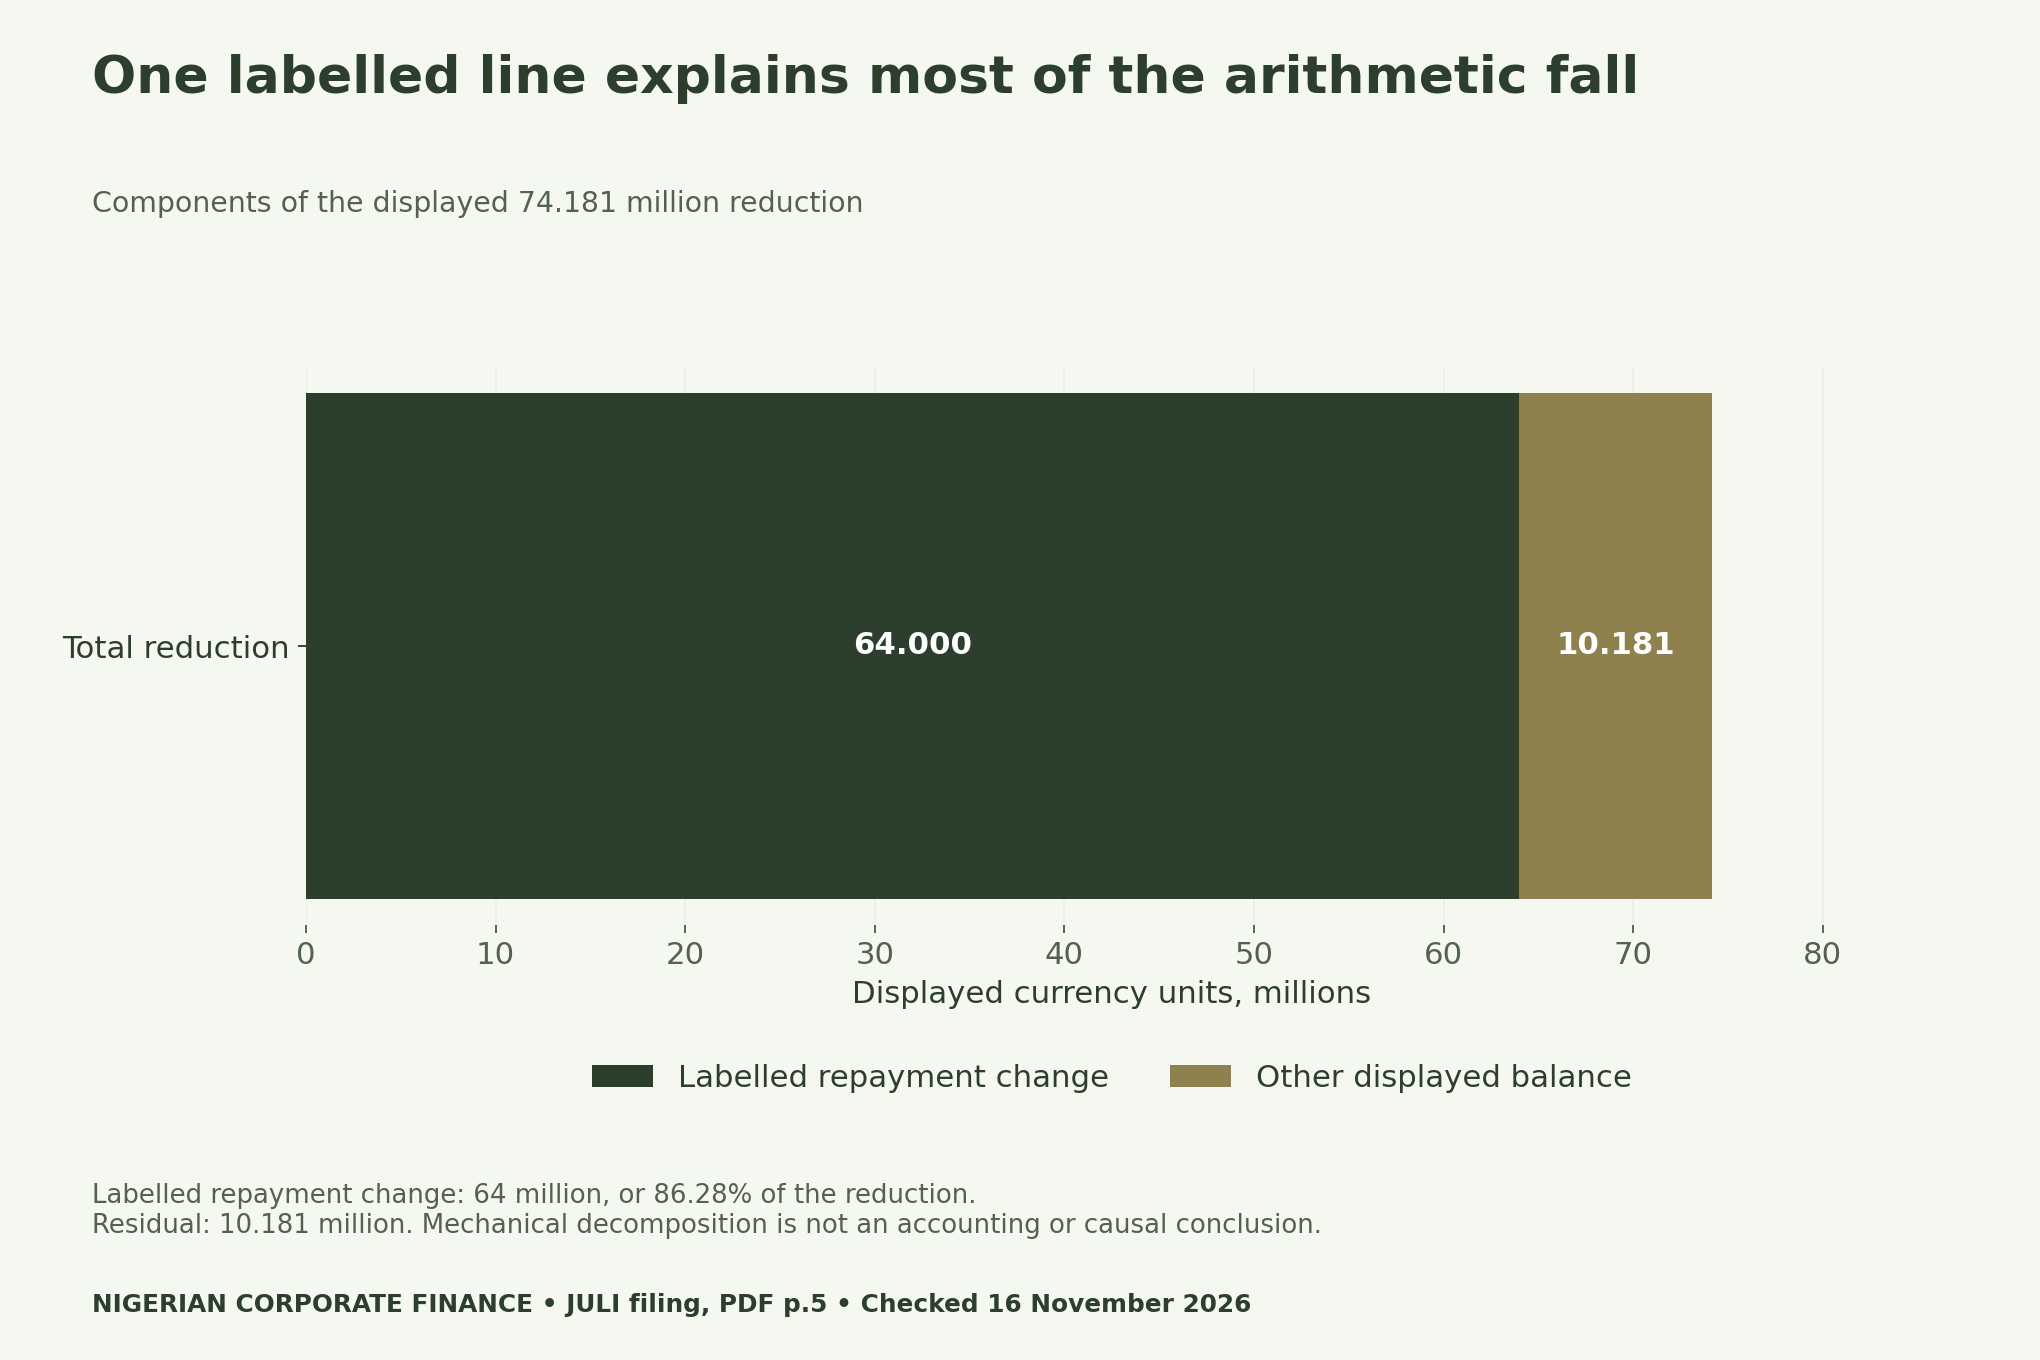
Keep the wording exactly as it appears. A repayment label does not tell us how much is principal, interest or another component. We have not obtained the supporting ledger, lender schedule or issuer explanation. Therefore, we cannot decide a reclassification merely from the line’s name.
The contribution percentage also needs the right denominator. Here it is the total displayed reduction, not turnover, opening debt or total expenses. It shows concentration in the change. It does not mean that 86.28% of all administrative expenses were loan repayments, nor that the company achieved an equivalent cash saving.
A diagnostic exclusion answers a narrower question
Subtract only the labelled line from each displayed total. The arithmetic subtotal becomes 112,068,034.87 for 2025 and 101,887,003.46 for 2026. Their reduction is 10,181,031.41, or 9.08% of the 2025 diagnostic subtotal. The denominator differs from the headline calculation.
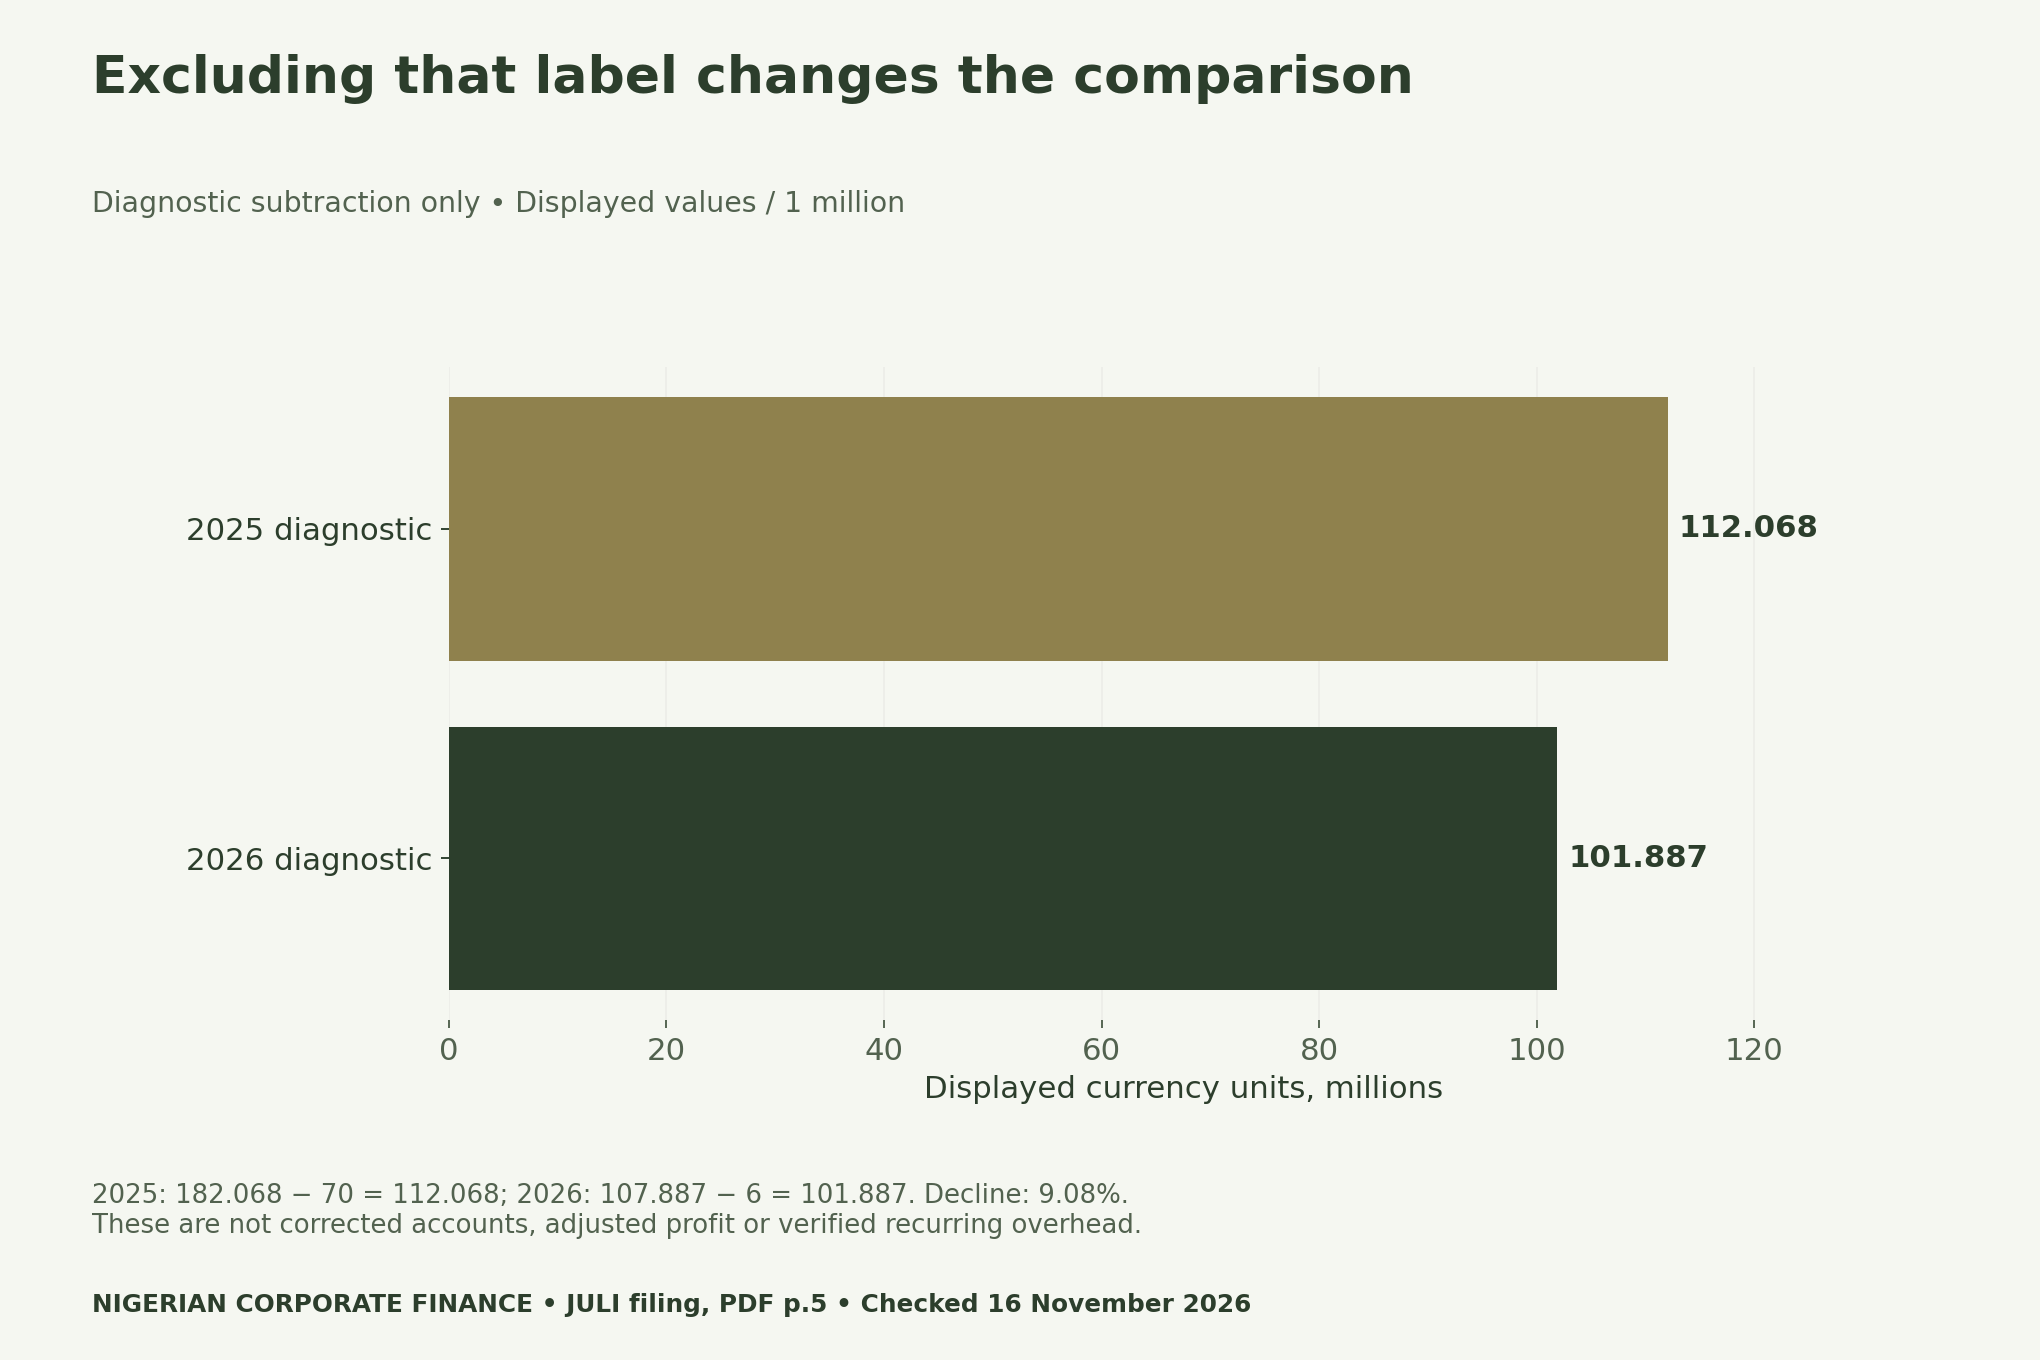
| Comparison | 2025 displayed-scale value | 2026 displayed-scale value | Reduction |
|---|---|---|---|
| Reported administrative total | 182,068,034.87 | 107,887,003.46 | 40.74% |
| Labelled repayment line | 70,000,000 | 6,000,000 | 64,000,000 in amount |
| Total less that line only | 112,068,034.87 | 101,887,003.46 | 9.08% |
This exercise tests how sensitive the headline is to one labelled item. It does not prove that every remaining item is recurring or comparable. A residual balance can still contain timing differences, one-off charges or presentation issues. Removing one line is therefore a question-generating technique, not a completed normalisation method.
Use a classification-first evidence workflow
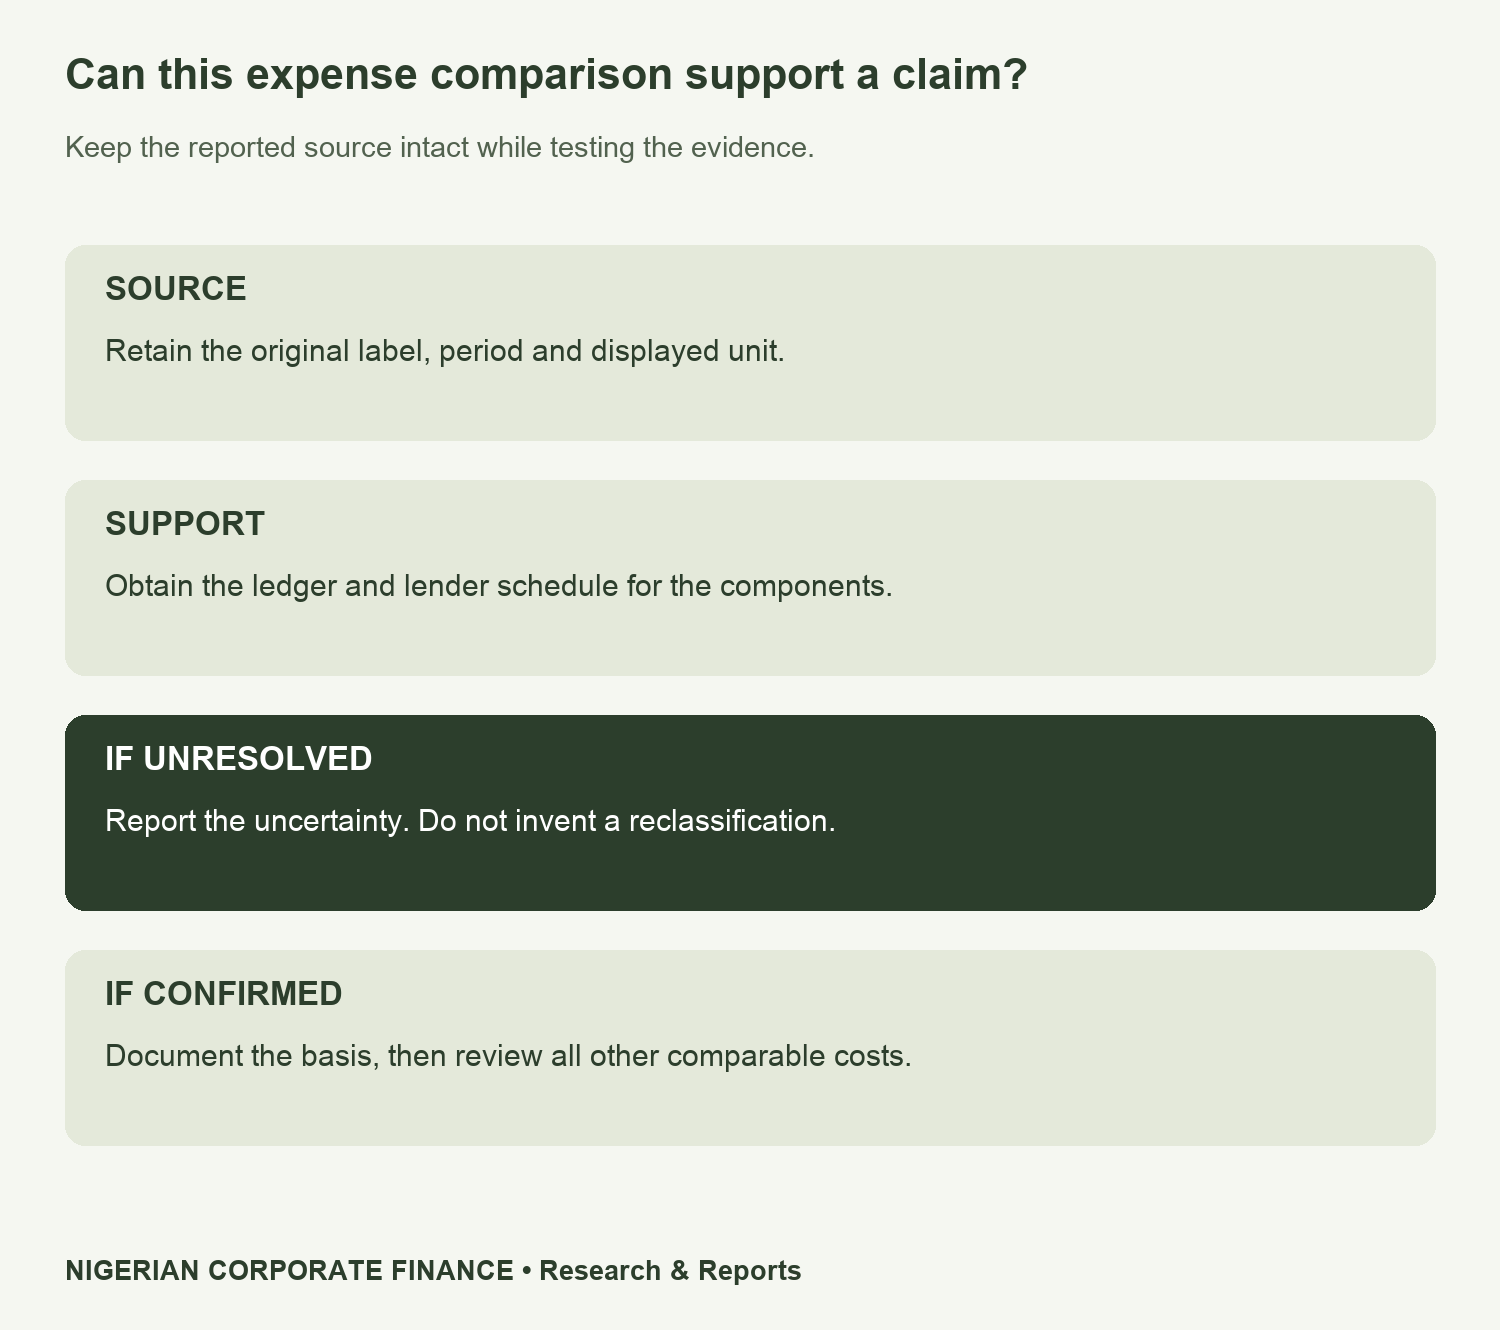
Start a source-cell register before making adjustments. Record the file version, PDF page, original wording, column year, displayed amount and unit qualification. Save the reported value in its own field. Place any editorial transformation in a separate calculation field so a reviewer can follow the trail back to the filing.
Next, identify the evidence needed for the particular claim. To understand a repayment entry, ask for a reconciliation of its components and the relevant ledger treatment. To compare recurring overhead, review the other costs as well. One supporting schedule cannot by itself settle every boundary in a normalised measure.
Where evidence is missing, retain an unresolved status. Do not convert an unanswered question into a zero amount, assumed interest expense or invented principal split. A short register saying what remains unknown is more useful than a precise-looking adjusted total built on an unsupported classification.
Write the finding at the level the evidence supports
A defensible description is that the displayed administrative total decreased and that most of its arithmetic reduction sits in the labelled repayment line. A separate diagnostic subtraction produces a smaller percentage decline. Both calculations can be reproduced without asserting that either subtotal measures sustainable operating efficiency.
Avoid replacing the company’s reported result in a chart or table with an editorial number bearing the same label. If a later supported adjustment is made, show the original figure, adjustment, evidence and resulting measure separately. State the period and units every time the comparison changes scope.
These observations are not allegations of misconduct. Source presentation issues limit interpretation; they do not authorise a conclusion about intention, accounting compliance, solvency or creditworthiness. This article makes no recommendation to buy, sell or extend credit.
Use the blank review file and unresolved register
The blank CSV lets an analyst list a source item, its period, unit confirmation, supporting schedule and classification status. Leave component amounts blank until verified. A blank is a missing answer; it is not automatically zero. The file contains fields and values, not an automated accounting decision.
The unresolved-evidence register also distinguishes a version check from a substantive review. The 11 November document was the latest JULI Q3 filing listed at our 16 November check. A later amendment could change the analysis. Reopen the official index before reusing the figures in a new report or an operational decision.
Our wider financial analysis coverage provides related methods. This case focuses on the validity of an expense-comparison claim, rather than rebuilding cash flow or inferring a company valuation from an incomplete disclosure.
Method, source boundaries and downloads
We visually checked PDF page 5, preserved its original labels and reproduced subtraction and percentage calculations using the displayed values. Figures are rounded for charts; the CSV retains the source-cell precision. Supporting pages show why period and unit consistency need clarification. No private ledger or lender confirmation was accessed.
Qualified accounting review and appropriately clarified source evidence should precede any adjusted operating-profit, cash-flow, solvency or credit conclusion. This publication stops at a limited disclosure diagnostic. The worksheets help organise questions; they do not certify that the accounts have been corrected.
- Source cells, original labels and unit caveats (CSV)
- Diagnostic arithmetic and formulas (CSV)
- Blank expense-classification review (CSV)
- Unresolved evidence and interpretation limits (CSV)
Suggested citation: Nigerian Corporate Finance, “JULI Q3 2026 Overhead Analysis: Check Expense Labels Before Cost-Cut Claims”, 16 November 2026. Source: JULI filing listed by NGX on 11 November, PDF page 5; diagnostic calculations by the publication.


