





A Coronation Infrastructure Fund NAV reconciliation connects accumulated capital, profit and distributions. The September management account reports ₦9.437031 billion of net assets. Its component bridge reproduces that number exactly, while a separate assets-less-liabilities check leaves an unresolved ₦1,000 difference.
This guide shows both checks, then separates recognised interest from cash received by an investor. It includes three charts, a measure-selection infographic and four free CSV tools. The work is a reporting case study, rather than a fund recommendation. Research checked on 12 November 2026.
Coronation Infrastructure Fund NAV: keep three dates separate
The reviewed management account measures the period ended 30 September 2026. Page 2 states management approval on 23 October. The filing appears in the 6 November exchange-disclosure record used for the brief. These are measurement, approval and release dates; November is not the income measurement period.
Our source is the five-page management account, rather than the separate quarterly investor report posted in October. Do not merge two documents simply because they refer to September. Retain each document’s title, version, scope and date so a reader can reproduce the comparison.
Rebuild the component bridge in the source units
The account uses thousands of naira, shown as ₦000. Keep that unit while calculating. Contributions of 8,790,000, retained earnings of 2,750,447 and current profit of 1,204,173 sum to 12,744,620. Subtract the cumulative distribution balance of 3,307,589 to obtain reported NAV of 9,437,031.
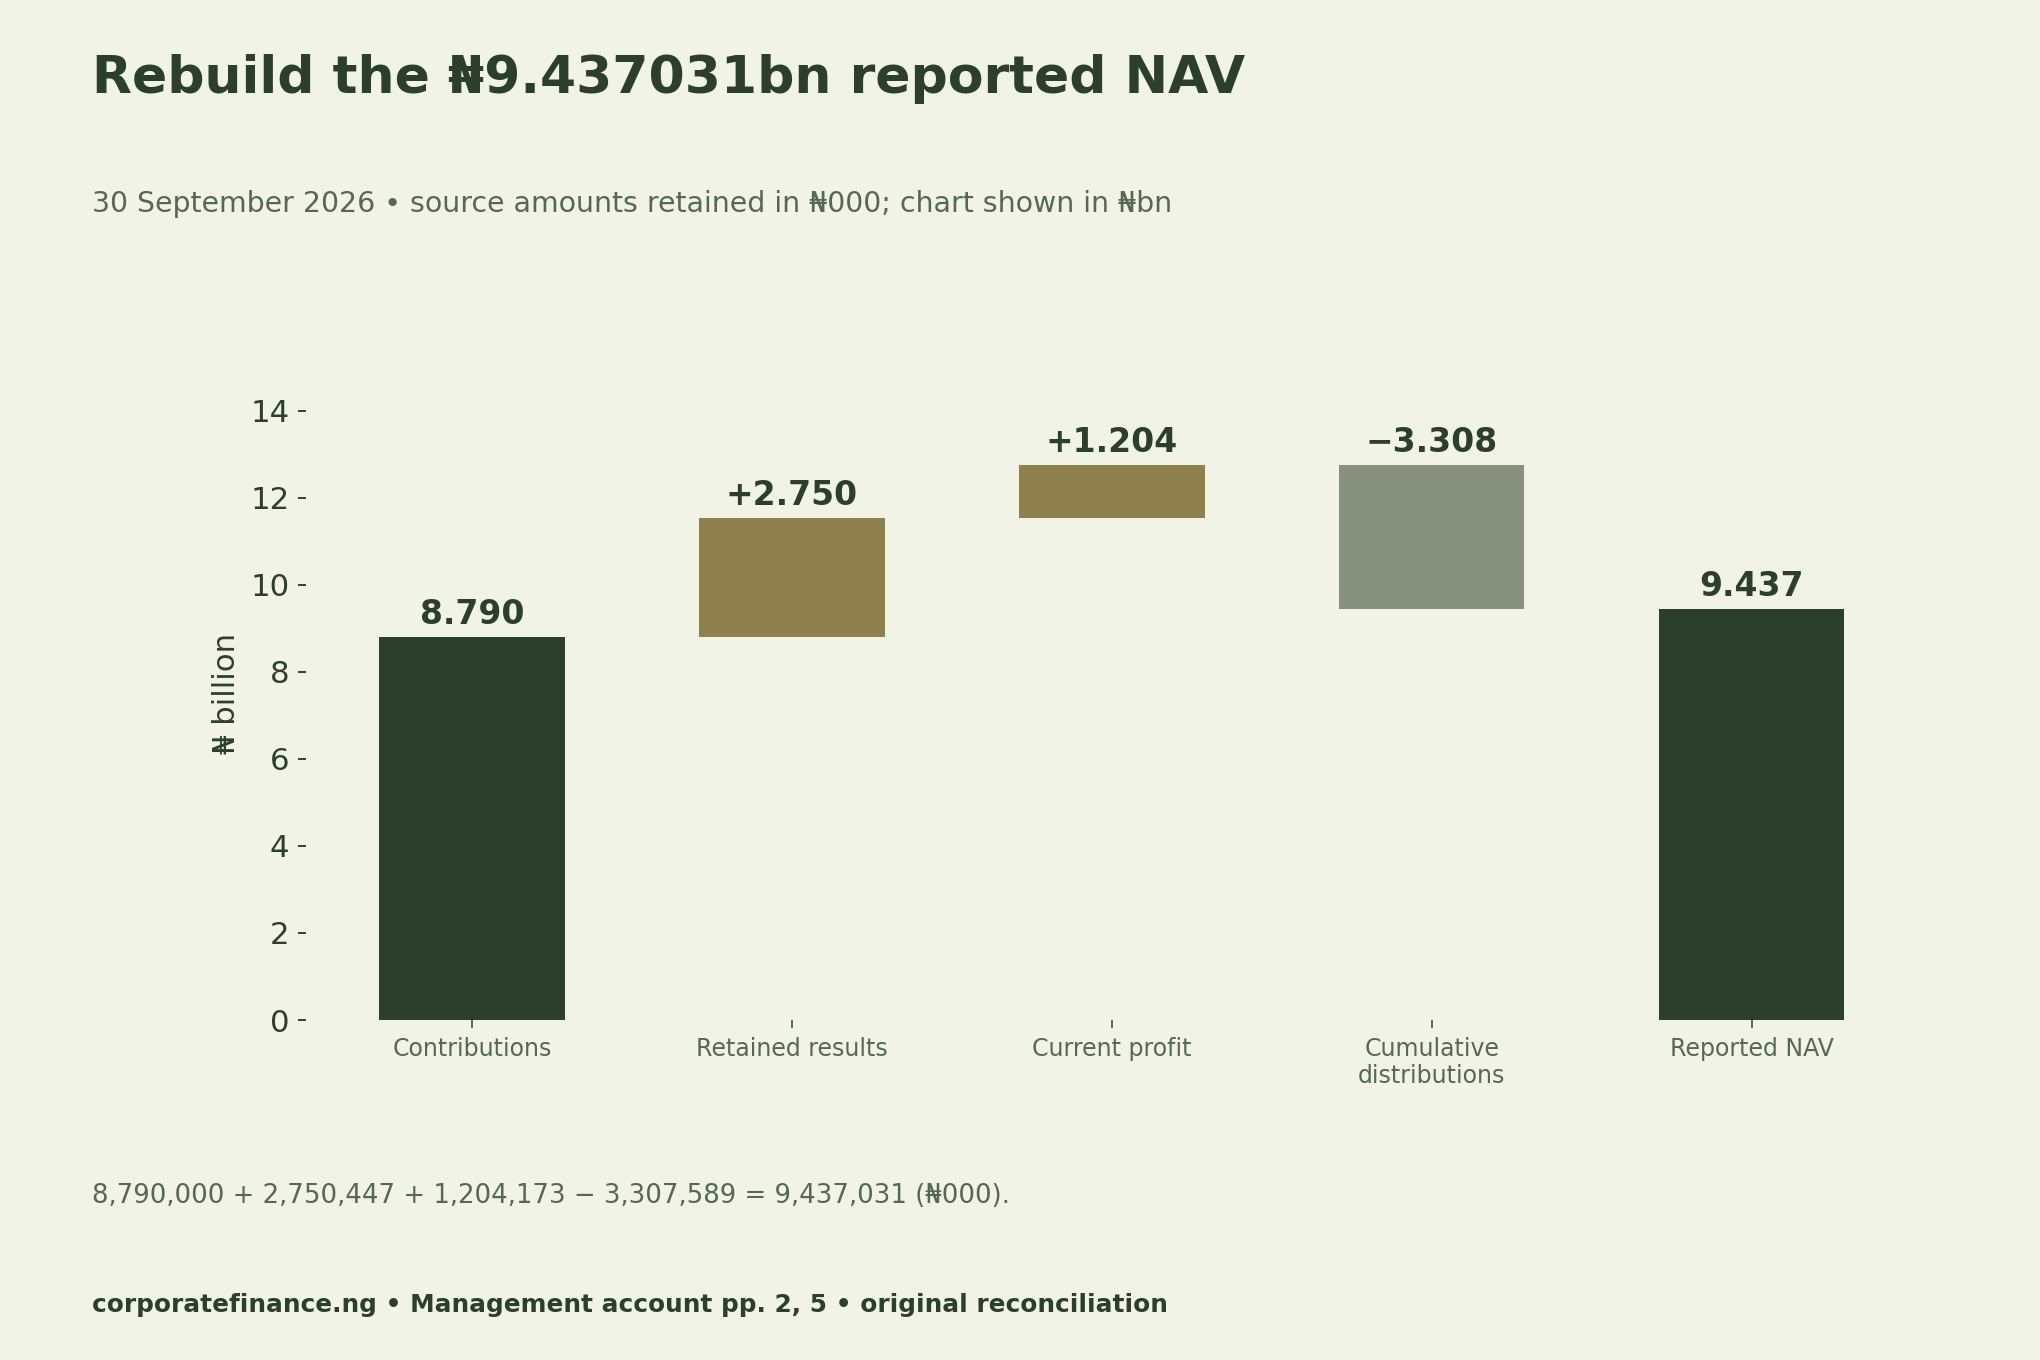
The distribution balance includes 1,716,951 brought forward and a movement of 1,590,638, both in ₦000. Together they equal 3,307,589. Therefore, it is not simply the current quarter’s payment or a particular holder’s receipt. The balance is already deducted in this bridge.
Subtracting the same cumulative distributions again from the reported NAV would double count them. Start by identifying whether a figure is a balance, a period movement or an individual cash flow. Similar labels do not make those measures interchangeable.
| Component | Signed amount (₦000) |
|---|---|
| Unitholders’ contributions | 8,790,000 |
| Retained earnings | 2,750,447 |
| Profit for the year | 1,204,173 |
| Cumulative distributions | −3,307,589 |
| Reconciled reported NAV | 9,437,031 |
Preserve the ₦1,000 difference in the other check
The position statement reports assets of 9,501,879 and liabilities of 64,847, in ₦000. Subtracting them gives 9,437,032. That is one unit of ₦000 above reported NAV of 9,437,031. We record the unresolved difference as ₦1,000 without changing any line to force agreement.
The component bridge independently matches reported NAV. However, that does not explain the small position-statement difference. Its cause could only be established from a clarification or supporting records. The discrepancy is not, by itself, evidence of misconduct or a quantified investor loss.
Read interest composition within each reporting window
The notes divide YTD recognised interest of 1,346,024 into infrastructure-loan interest of 978,414 and placements of 367,610. For QTD, the figures are 401,662 and 62,595, totalling 464,257. All of these source amounts are in ₦000.
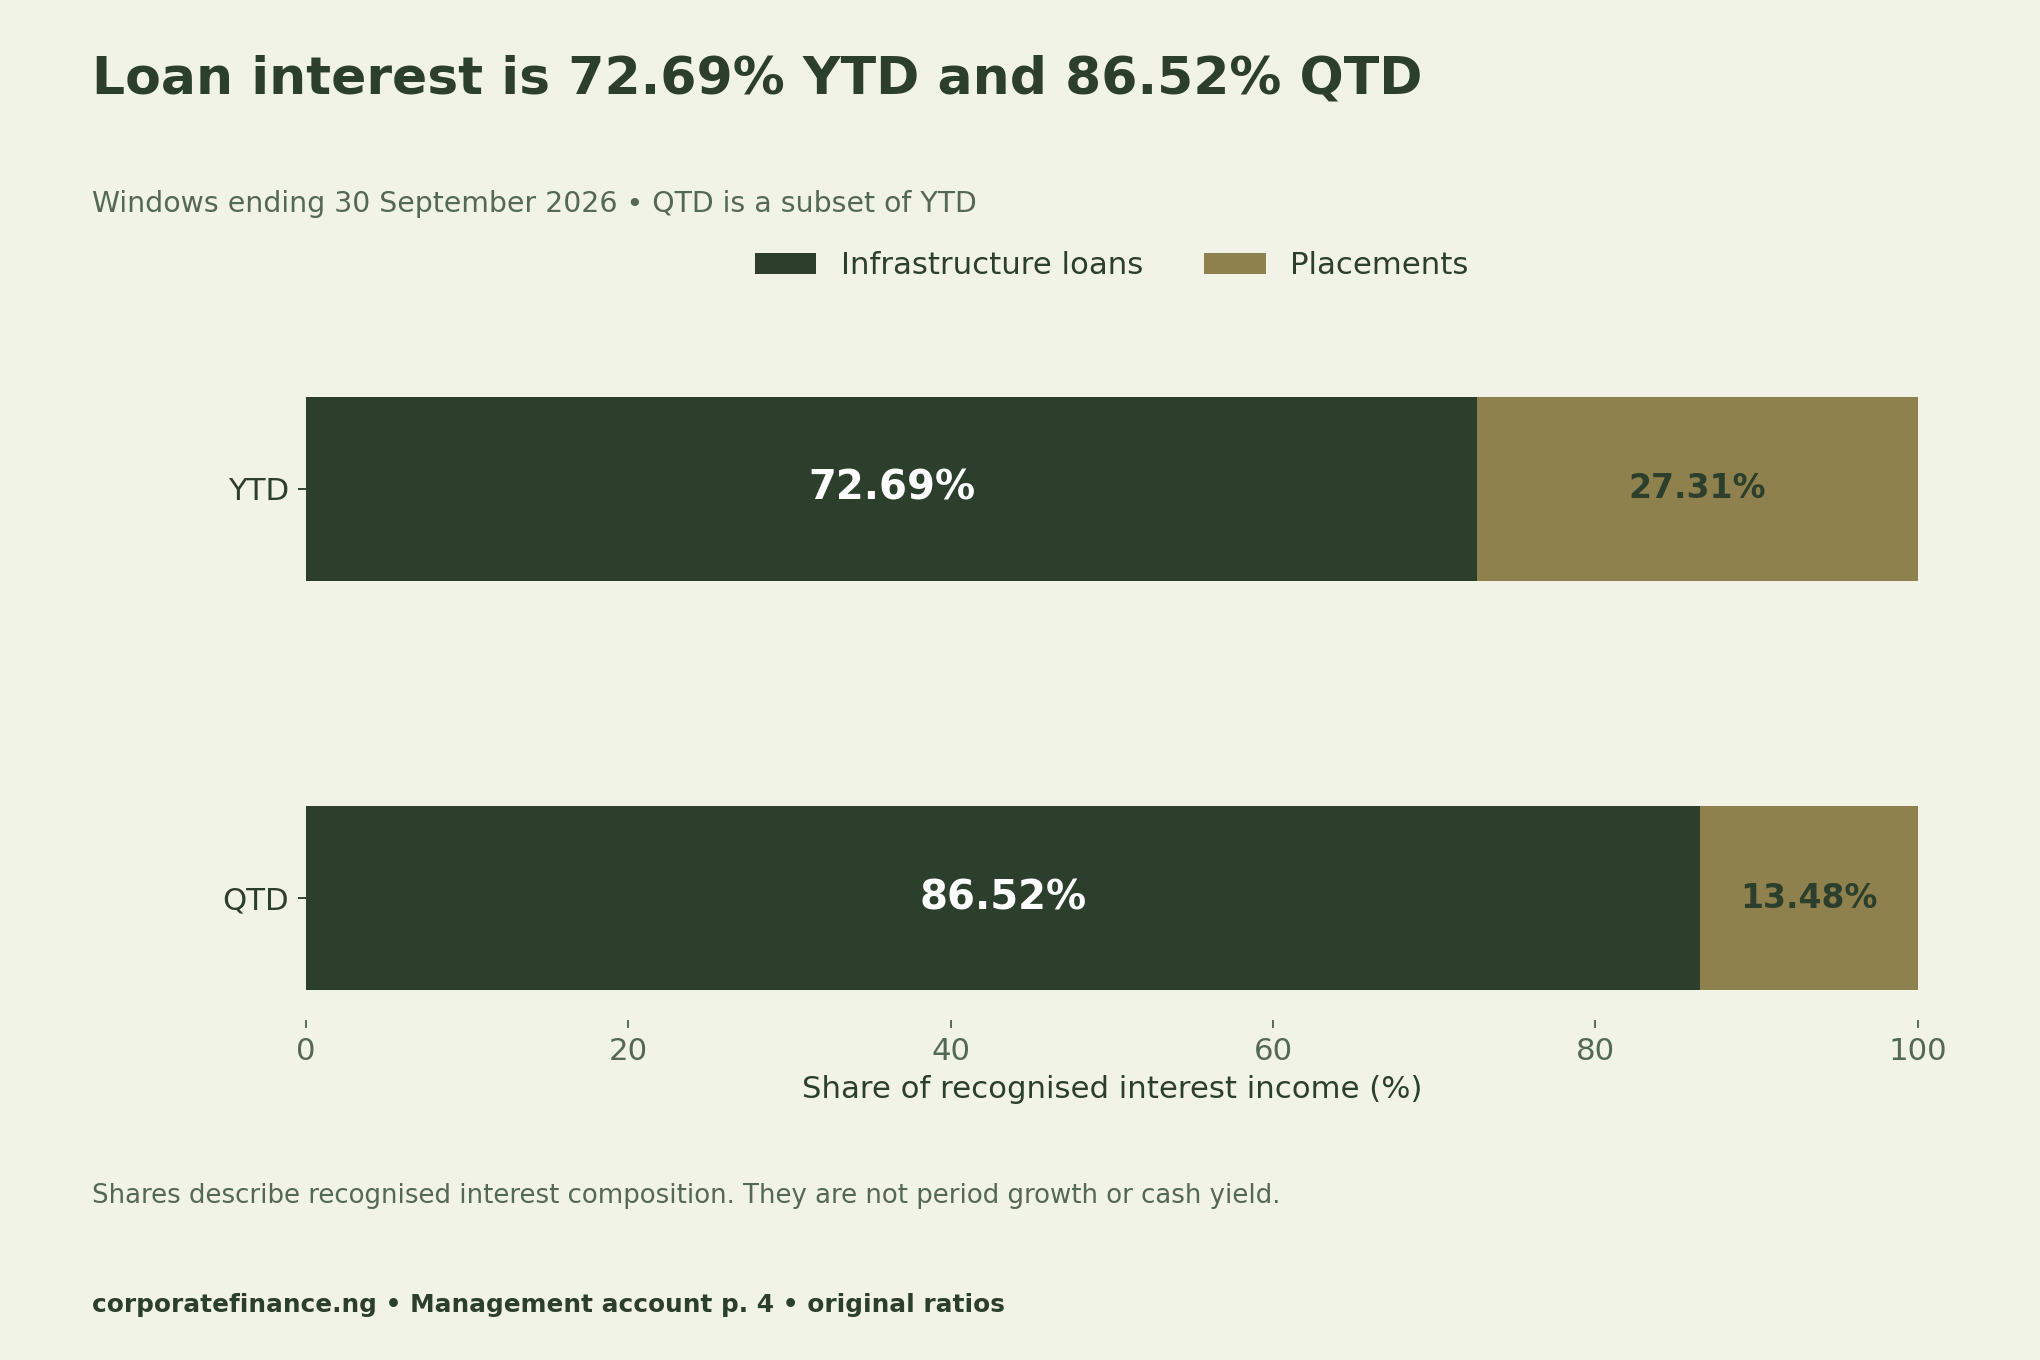
Calculate each loan share as loan interest divided by total interest for that same window. The results are 72.69% YTD and 86.52% QTD, rounded. Do not describe the difference between those shares as growth in interest or as proof of better risk-adjusted performance.
A change in composition can arise while the windows overlap. To study growth, first obtain comparable, non-overlapping periods and consistent definitions. To study cash collection, request cash-flow and receipt evidence. The recognised-interest table alone answers neither question.
Reconcile accounting profit as a separate bridge
YTD interest of 1,346,024 plus other income of 16,829, less operating expenses of 158,680, gives profit of 1,204,173, in ₦000. The QTD equivalent is 464,257 plus 8,815 less 56,103, giving 416,969. Both arithmetic checks reconcile to the account.
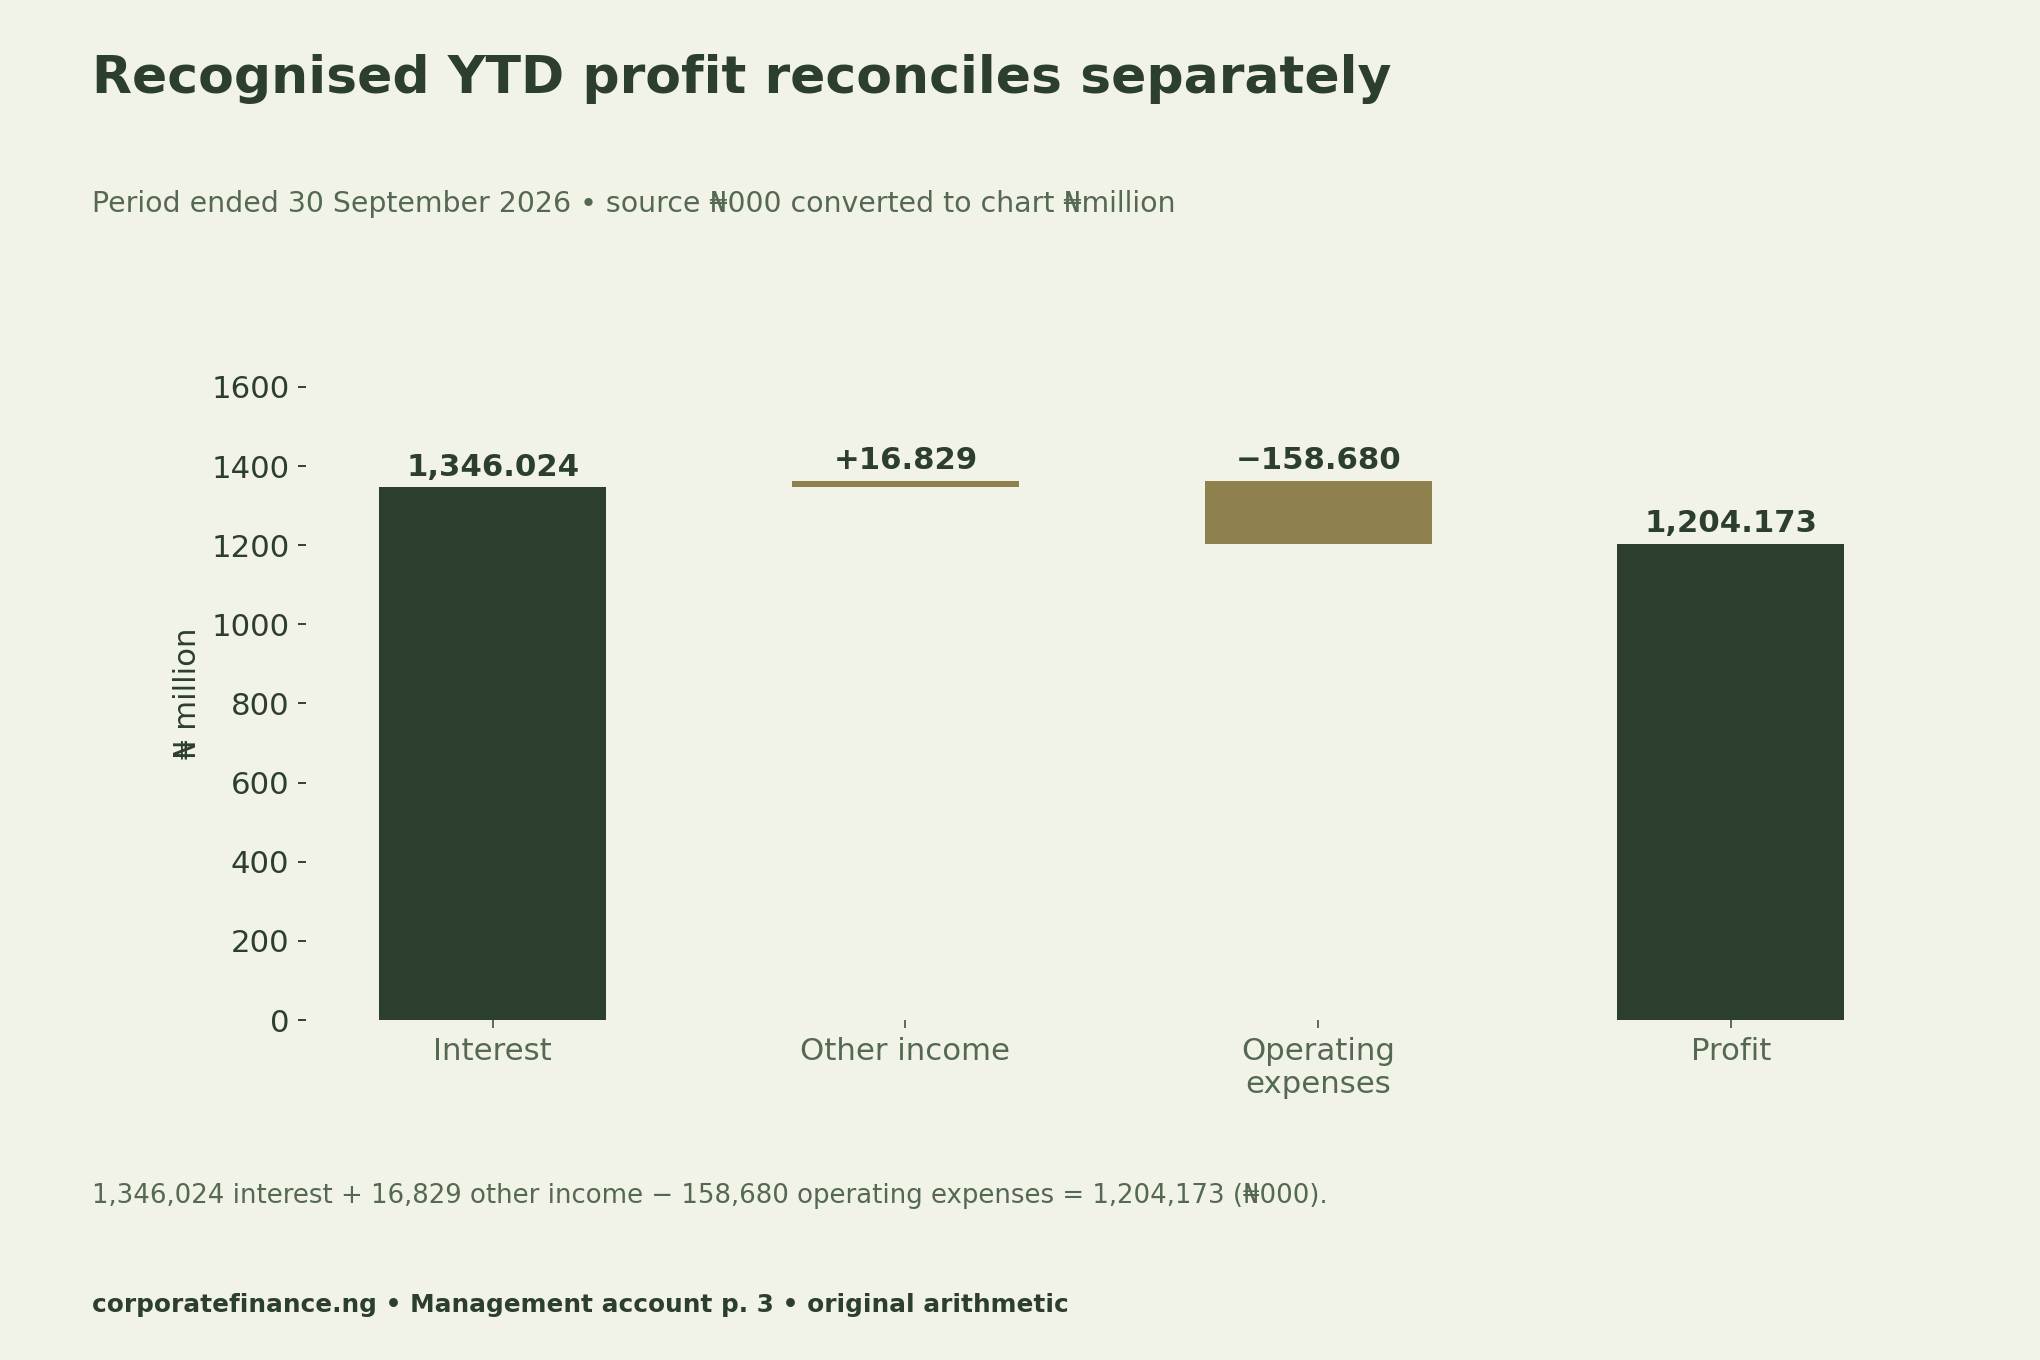
Profit enters the NAV component bridge, but its existence does not show that the same amount arrived in cash during the period. Similarly, income from loans does not establish borrower credit quality. Those assessments need supporting schedules, terms and further evidence.
Choose the measure before choosing the ratio
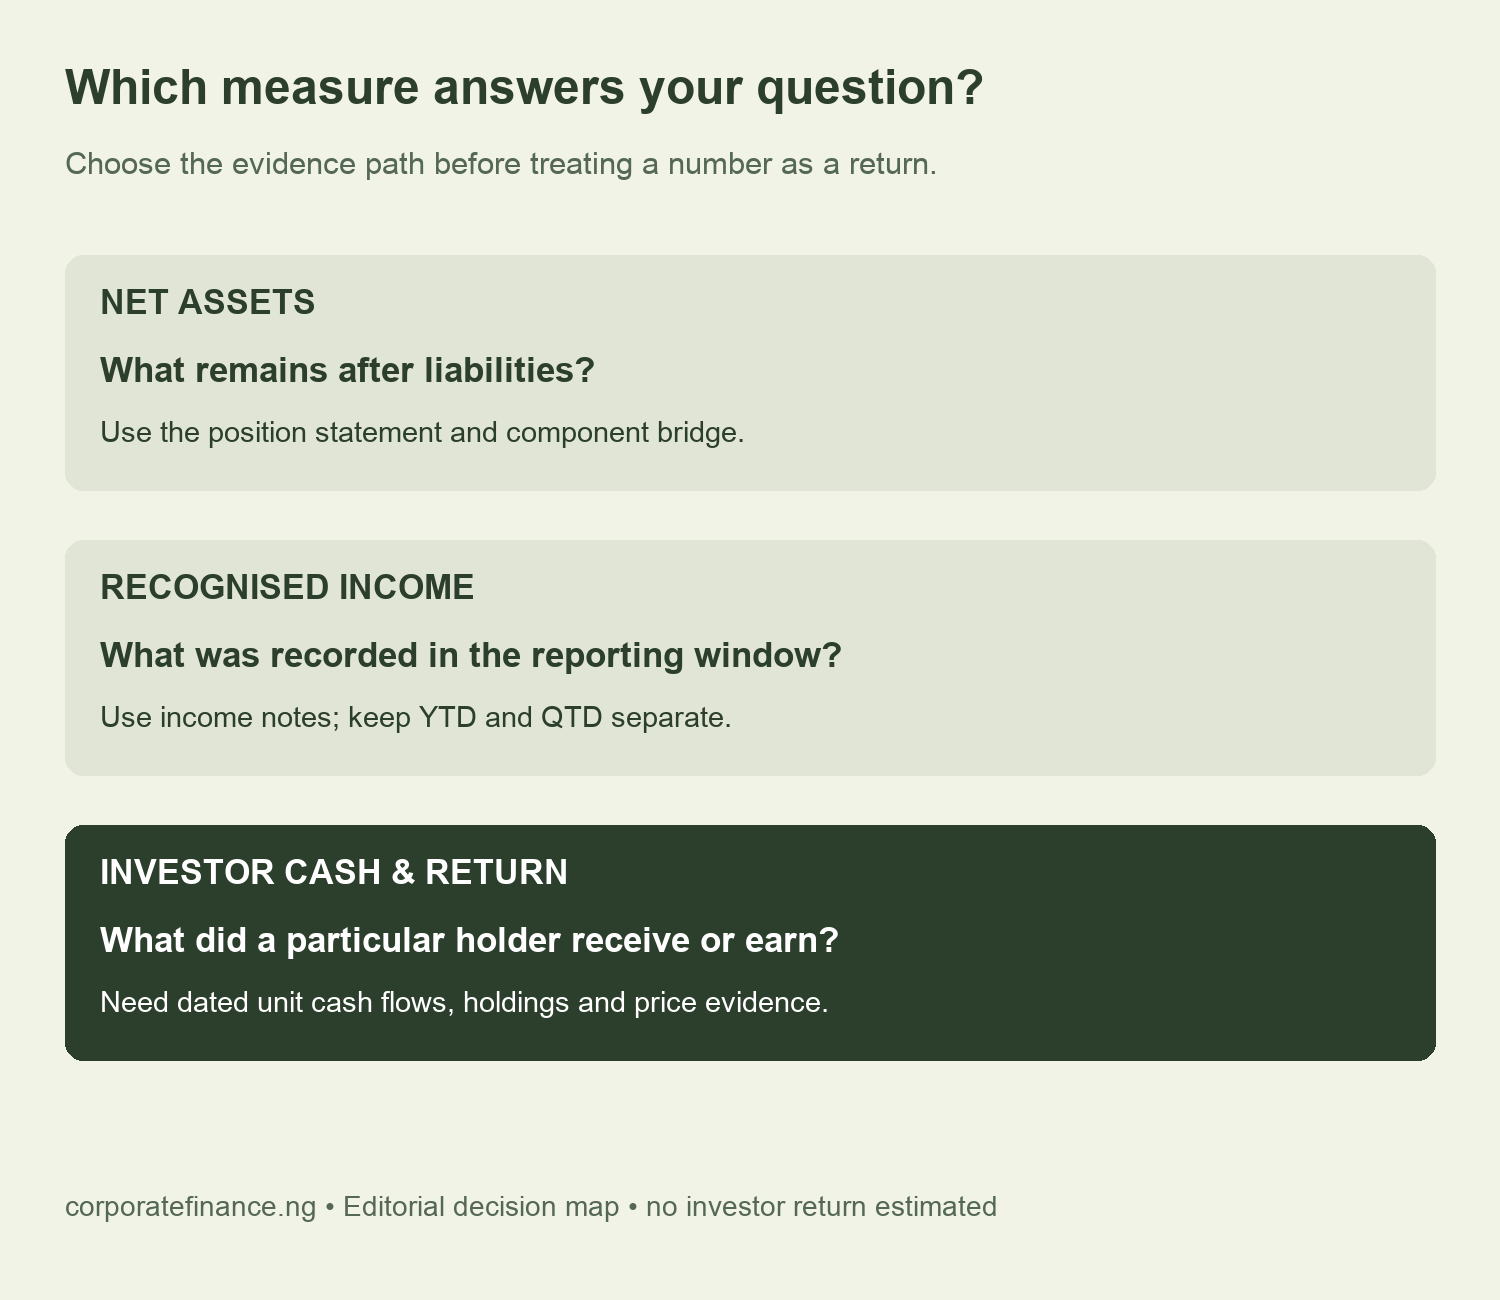
A holder’s return depends on their own purchase or opening value, units held, distribution entitlements, receipts, costs and ending value or sale proceeds. Timing also matters. A fund-level distribution balance cannot replace that record, and NAV is not automatically the exchange price available to a buyer or seller.
For a liquidity assessment, use a fuller schedule of realisable assets, terms, obligations and cash timing. The reviewed account is not a redemption-capacity test. Avoid turning a single balance-sheet line into an unsupported statement that cash is available on demand.
Download the source values and reconciliation tools
- September source values and PDF page references (CSV)
- NAV, distribution and income reconciliation checks (CSV)
- Blank fund NAV reconciliation register (CSV)
- Blank income and investor-cash evidence register (CSV)
The source sheet keeps the original ₦000 unit, while the derived sheet labels percentages separately. The blank registers do not insert a yield or recommend a product. Use an explicit source version and leave unresolved differences visible rather than overwriting the reported number.
For related evidence distinctions, see our Transcorp Power cash-equivalents analysis and NBET financing-to-receipt evidence map. Each keeps accounting labels, transaction milestones and cash evidence separate.
Methodology, limits and suggested citation
We extracted displayed integers from pages 2–5, checked the signed component sum and compared assets less liabilities with reported NAV. The retained calculations also reconcile both interest subtotals, both profit bridges and the brought-forward distribution balance plus movement. Charts convert units only after these checks.
This is a management account, not proof of a newly audited statement. No corrected version was identified in the reviewed primary materials. The analysis does not calculate a total investment return, evaluate loan concentration or credit quality, or establish redemption capacity. The release-date trail is less direct than the dated approval and measurement statements, so keep those evidence levels distinct.
Suggested citation: Nigerian Corporate Finance (12 November 2026), “Coronation Infrastructure Fund NAV: Rebuild the September Balance”, original calculations from the management account for the period ended 30 September 2026, pages 2–5. Attribute the source and retain the ₦1,000 unresolved difference.


