





Nigerian corporate debt currency mismatch analysis starts with the payment a company must make and the cash it can actually use. The OECD’s new Africa report offers regional context. It does not determine the currency exposure of a particular Nigerian borrower. This guide turns that distinction into four charts, an evidence matrix and four free CSV tools.
The OECD published its Africa Capital Markets Report 2026 on 6 November. The figures below describe 2025. Research checked on 12 November 2026. All company-level numbers in our worked examples are fictional, and none is a naira forecast or a tested corporate borrowing recommendation.
Corporate debt currency mismatch: define the regional measures
The report’s corporate-debt chapter reports USD 211 billion outstanding across its covered African corporate bond, syndicated-loan and private-credit markets at end-2025. Syndicated loans represent 81%. Separately, local-currency debt represents 17% of corporate issuance during 2025. A stock at a date and an issuance flow over a year use different denominators.
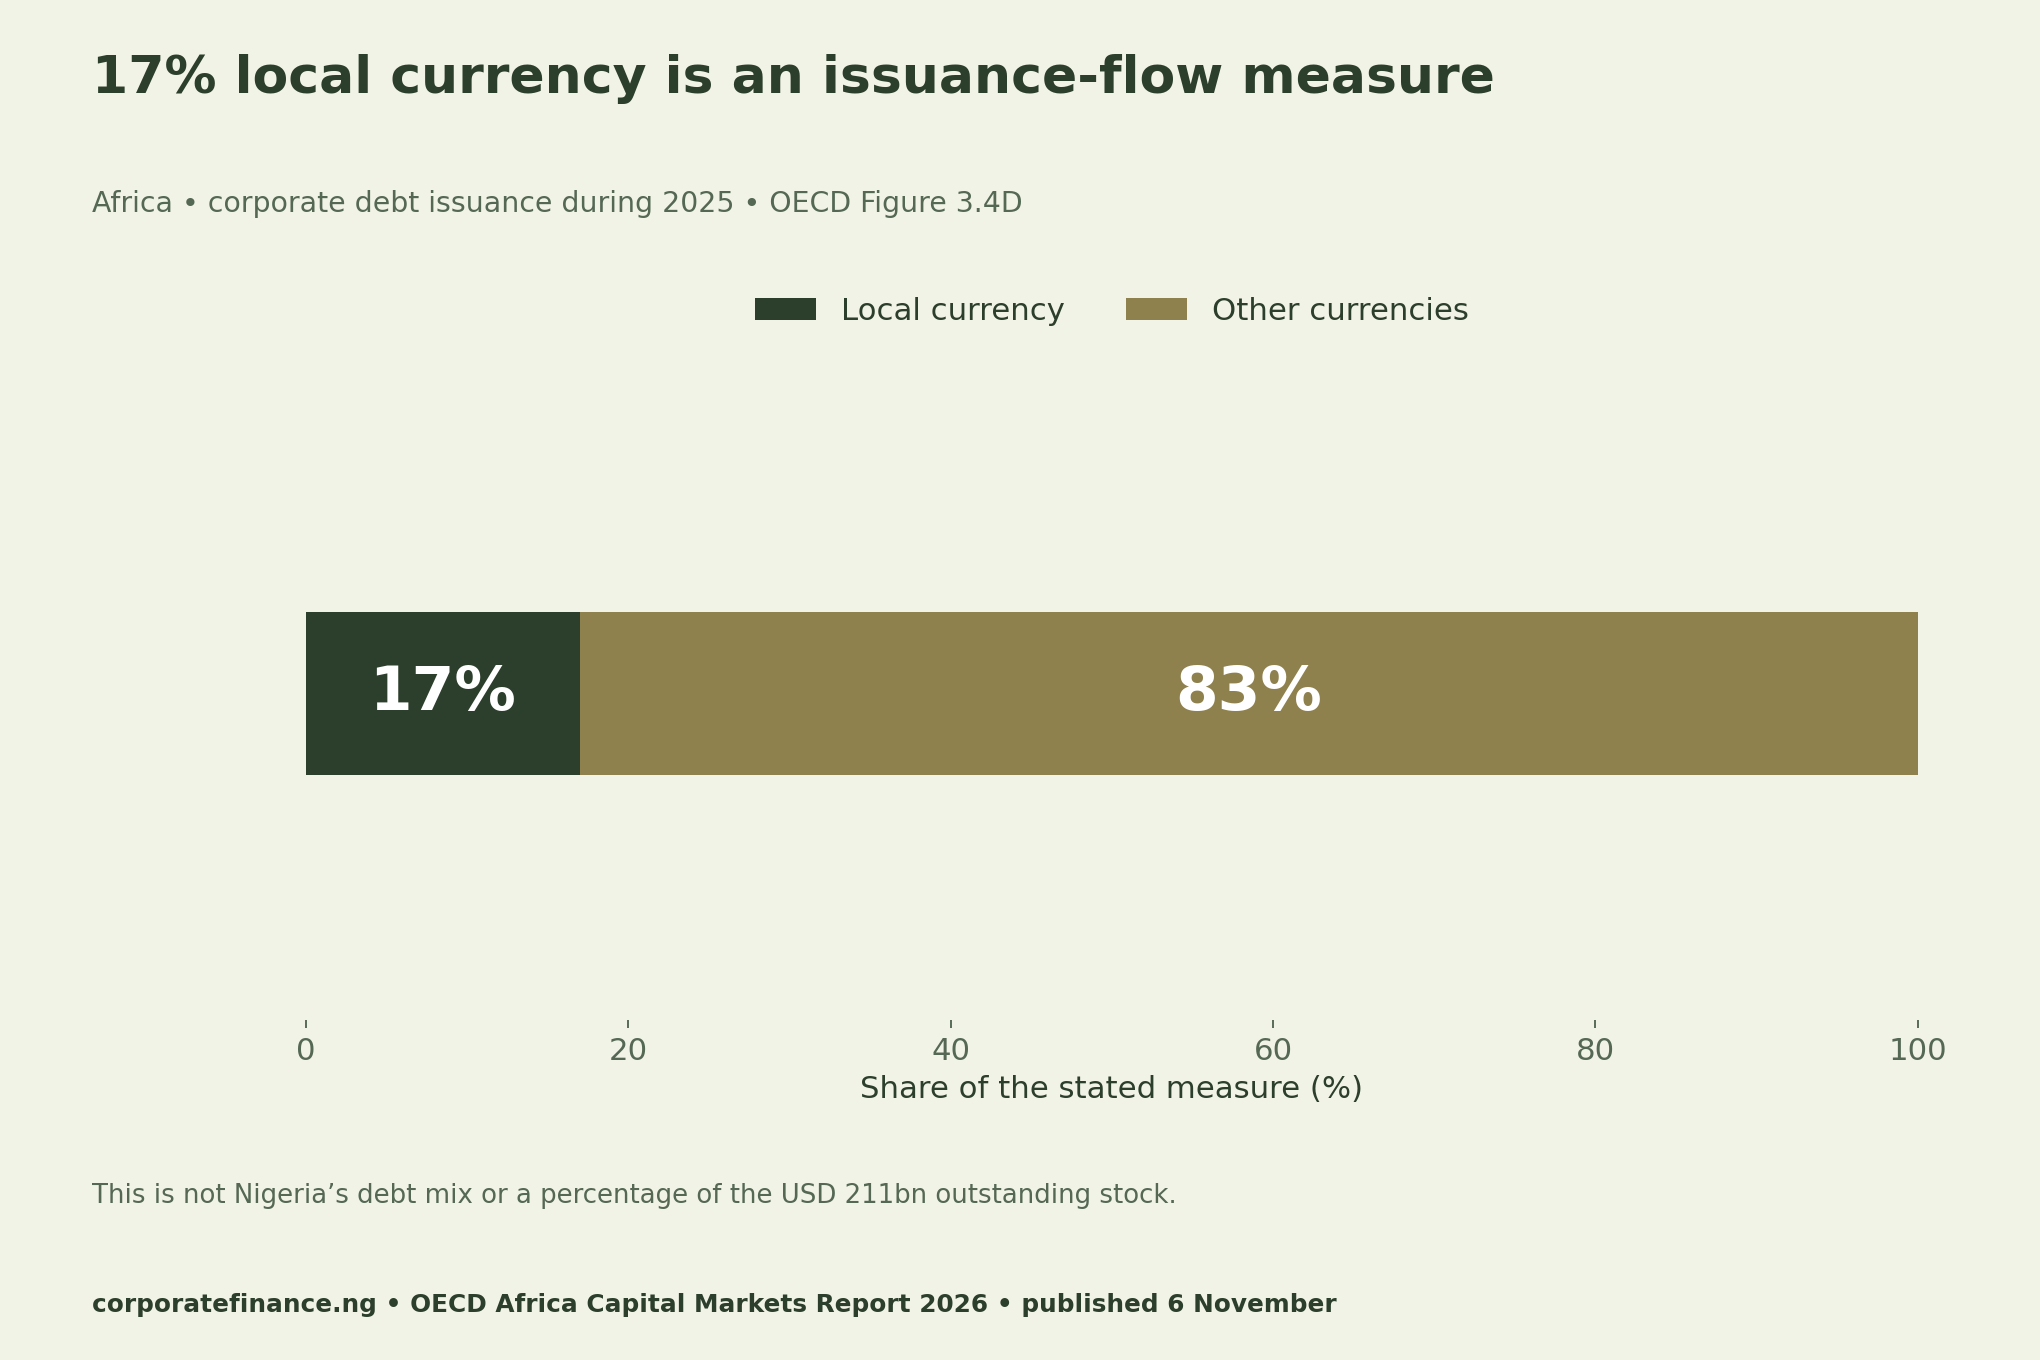
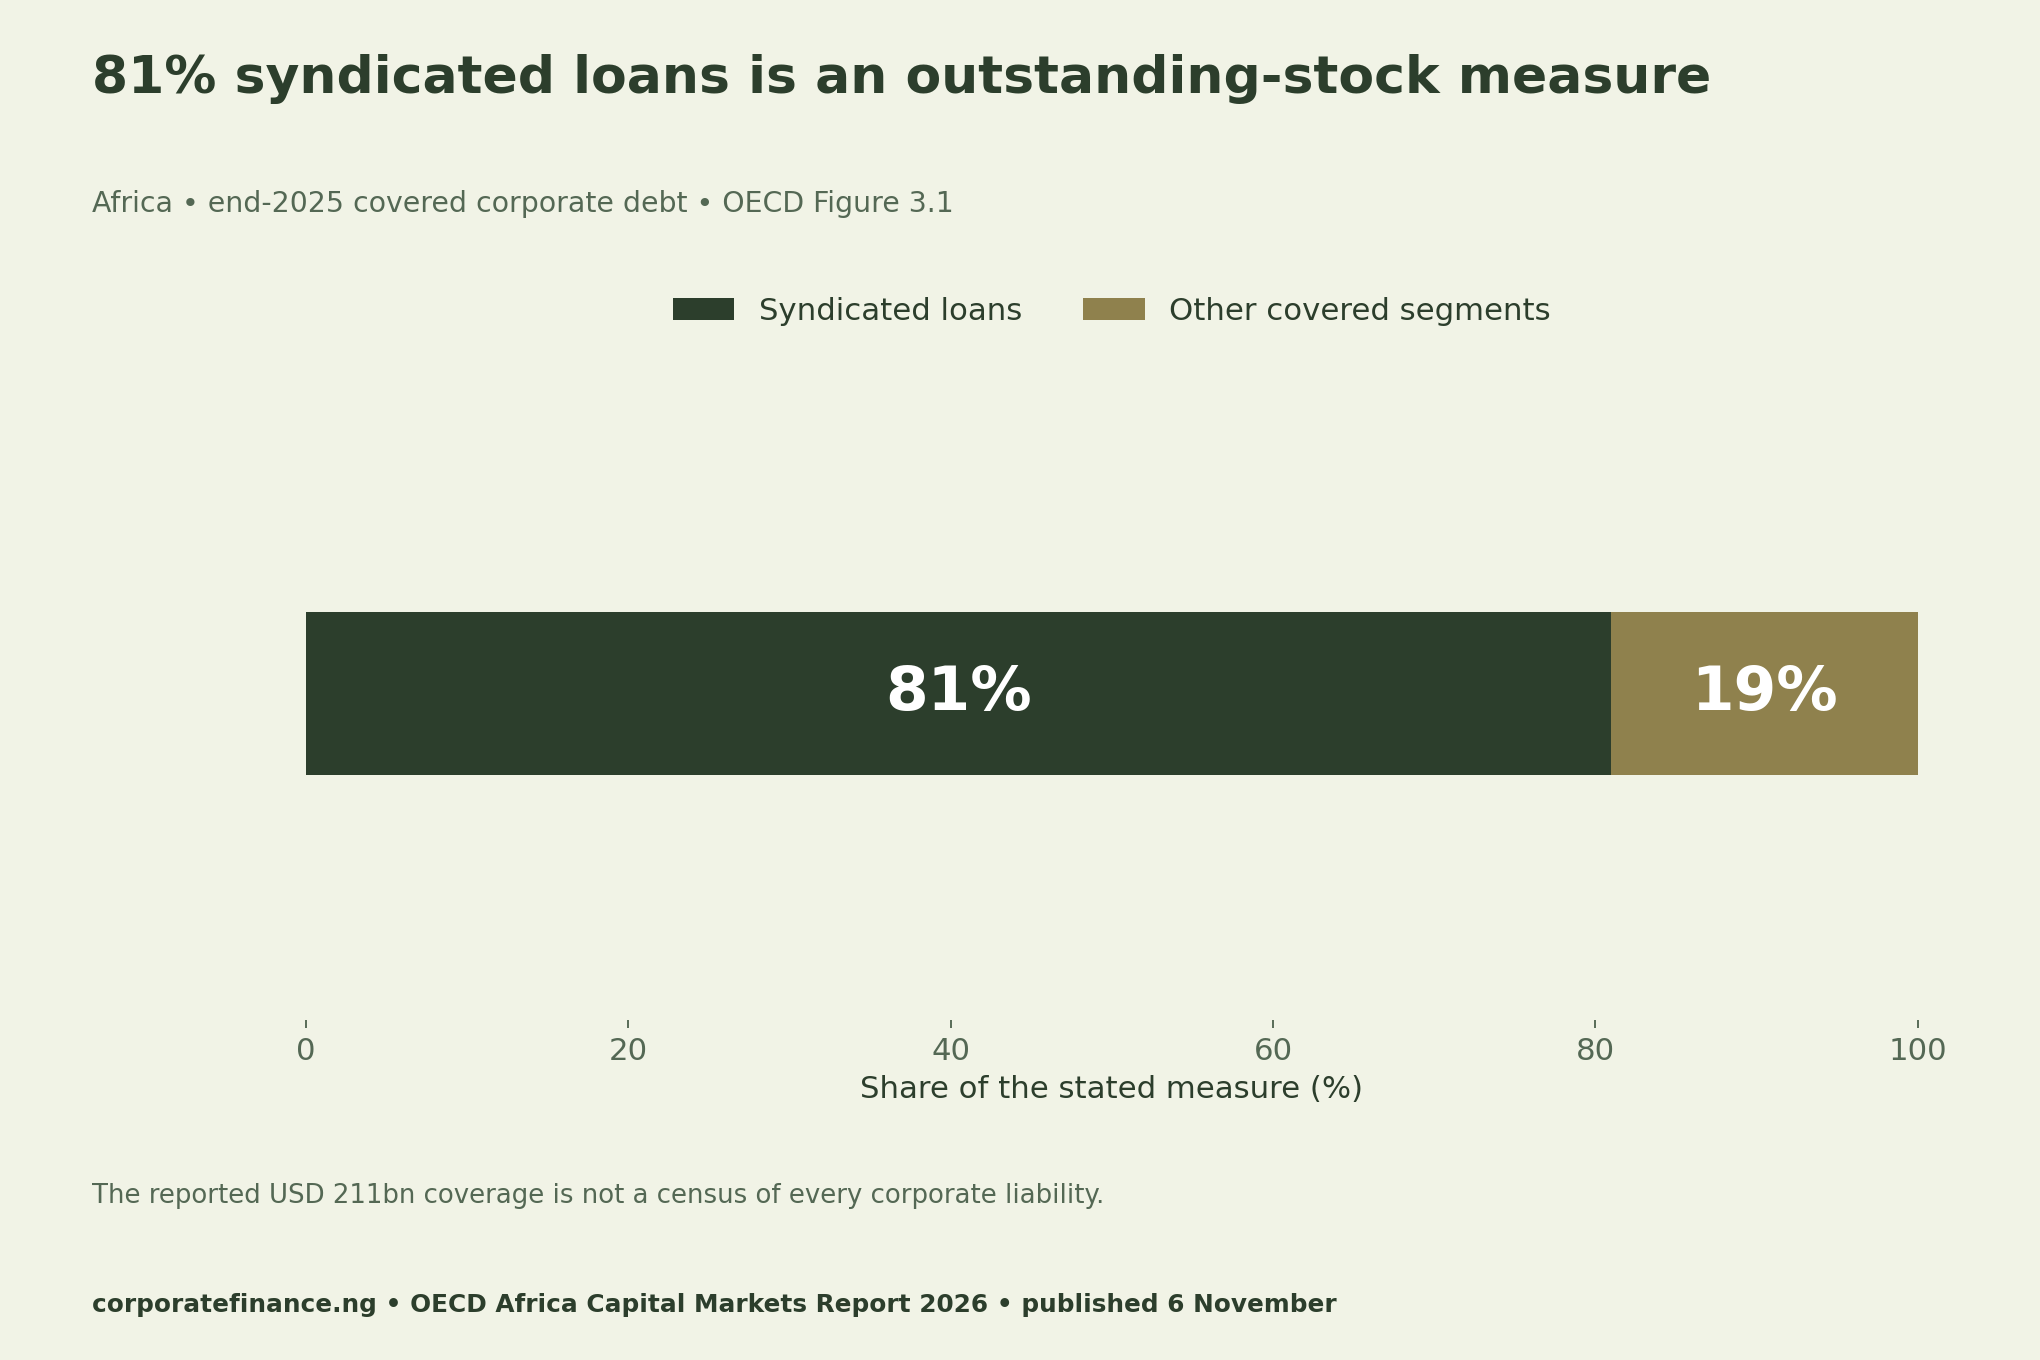
Nigeria is one of six countries together accounting for 80% of outstanding debt. That group share is not Nigeria’s individual amount. Also, 17% multiplied by USD 211 billion would combine incompatible measures. We do not use that multiplication to estimate local-currency debt stock.
| Published measure | Reference and denominator | Cannot establish |
|---|---|---|
| USD 211bn | End-2025 covered regional outstanding debt | Every company’s liabilities |
| 81% syndicated | Share of covered outstanding debt | Annual issuance mix |
| 17% local currency | 2025 regional corporate issuance | Nigeria-only share or unhedged exposure |
| 80% in six countries | Combined country-group outstanding share | Nigeria’s individual share |
Move from the regional headline to a company payment
Start the company worksheet with a contractual payment amount, currency and due date. Then identify same-currency receipts available before that date, after other commitments. Gross sales are not automatically free cash for debt service. A receipt due after the payment cannot be treated as already available.
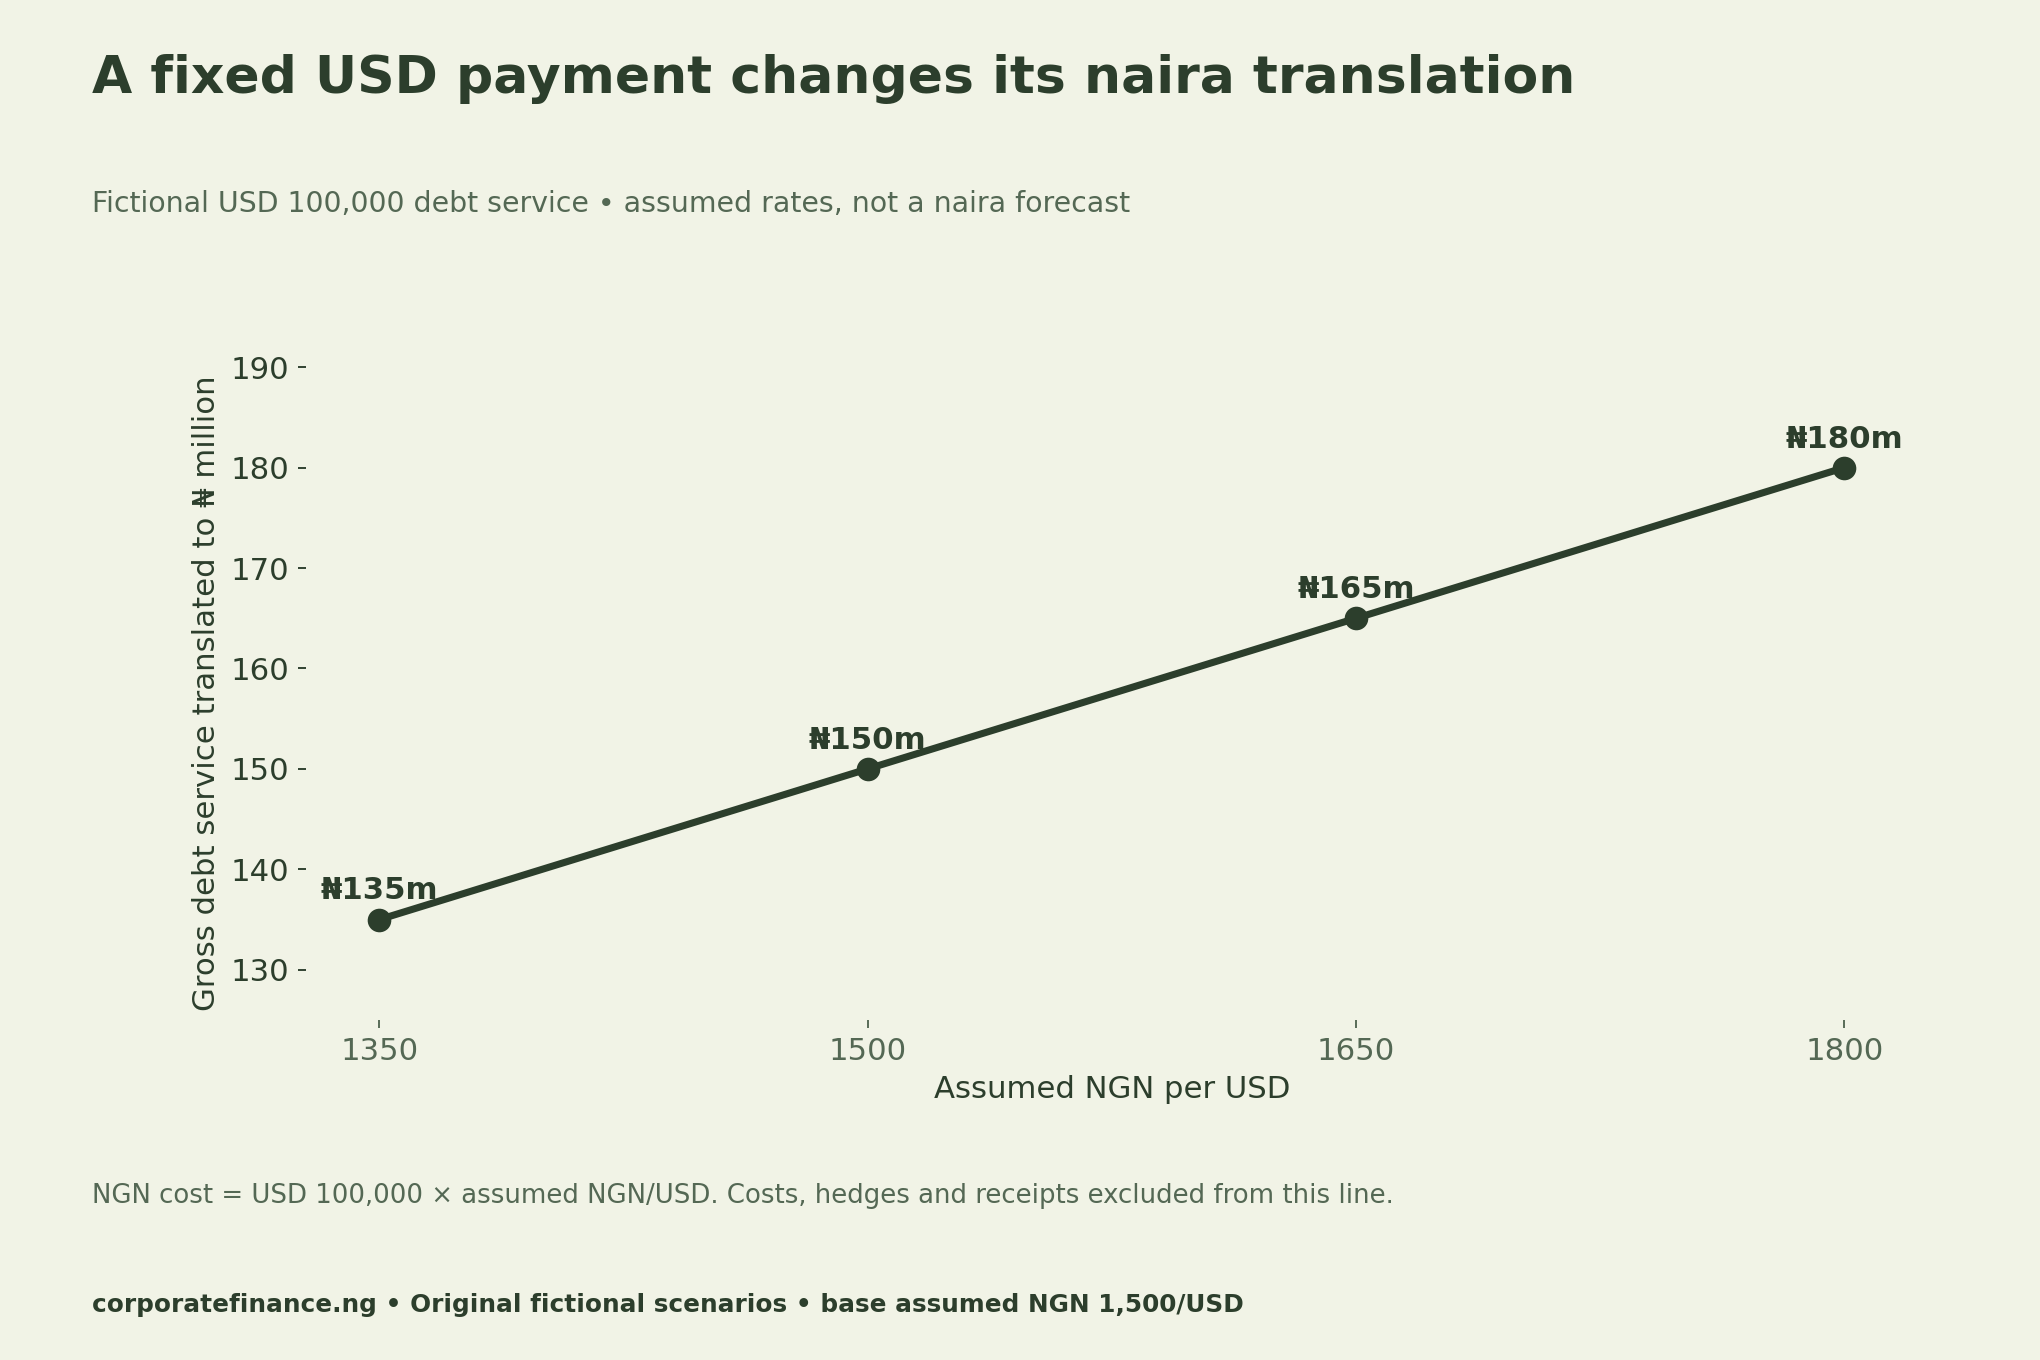
For a simple fixed foreign-currency payment, naira translation equals payment units multiplied by naira per currency unit. That formula describes a translation scenario. It does not choose a funding product, estimate a probability or predict an exchange rate.
Our fictional borrower owes USD 100,000. At an assumed ₦1,500 per USD, the gross translation is ₦150 million. An assumed ₦1,650 rate gives ₦165 million. The 10% rise in the assumed NGN/USD rate produces a 10% rise in the gross translated payment when the dollar amount stays fixed.
Record matched receipts before estimating the uncovered payment
Now assume USD 60,000 of net unrestricted receipts is available before payment. The remaining currency requirement is USD 40,000. At the same assumed rates, its translations are ₦60 million at 1,500 and ₦66 million at 1,650. This is the uncovered payment translation before conversion costs and separately documented hedge cash flows.
Keep the gross debt-service line and the uncovered requirement separate. The receipt assumption does not reduce the contractual dollar amount owed. It changes how much of that payment requires additional currency funding in this simplified example.
If a hedge exists, record its actual settlement mechanics, date and cash flows in separate fields. Do not automatically subtract the full notional amount from naira cost. The blank register leaves hedge fields empty until there is evidence. No hedge effectiveness has been tested here.
Test timing with a maturity-by-currency schedule
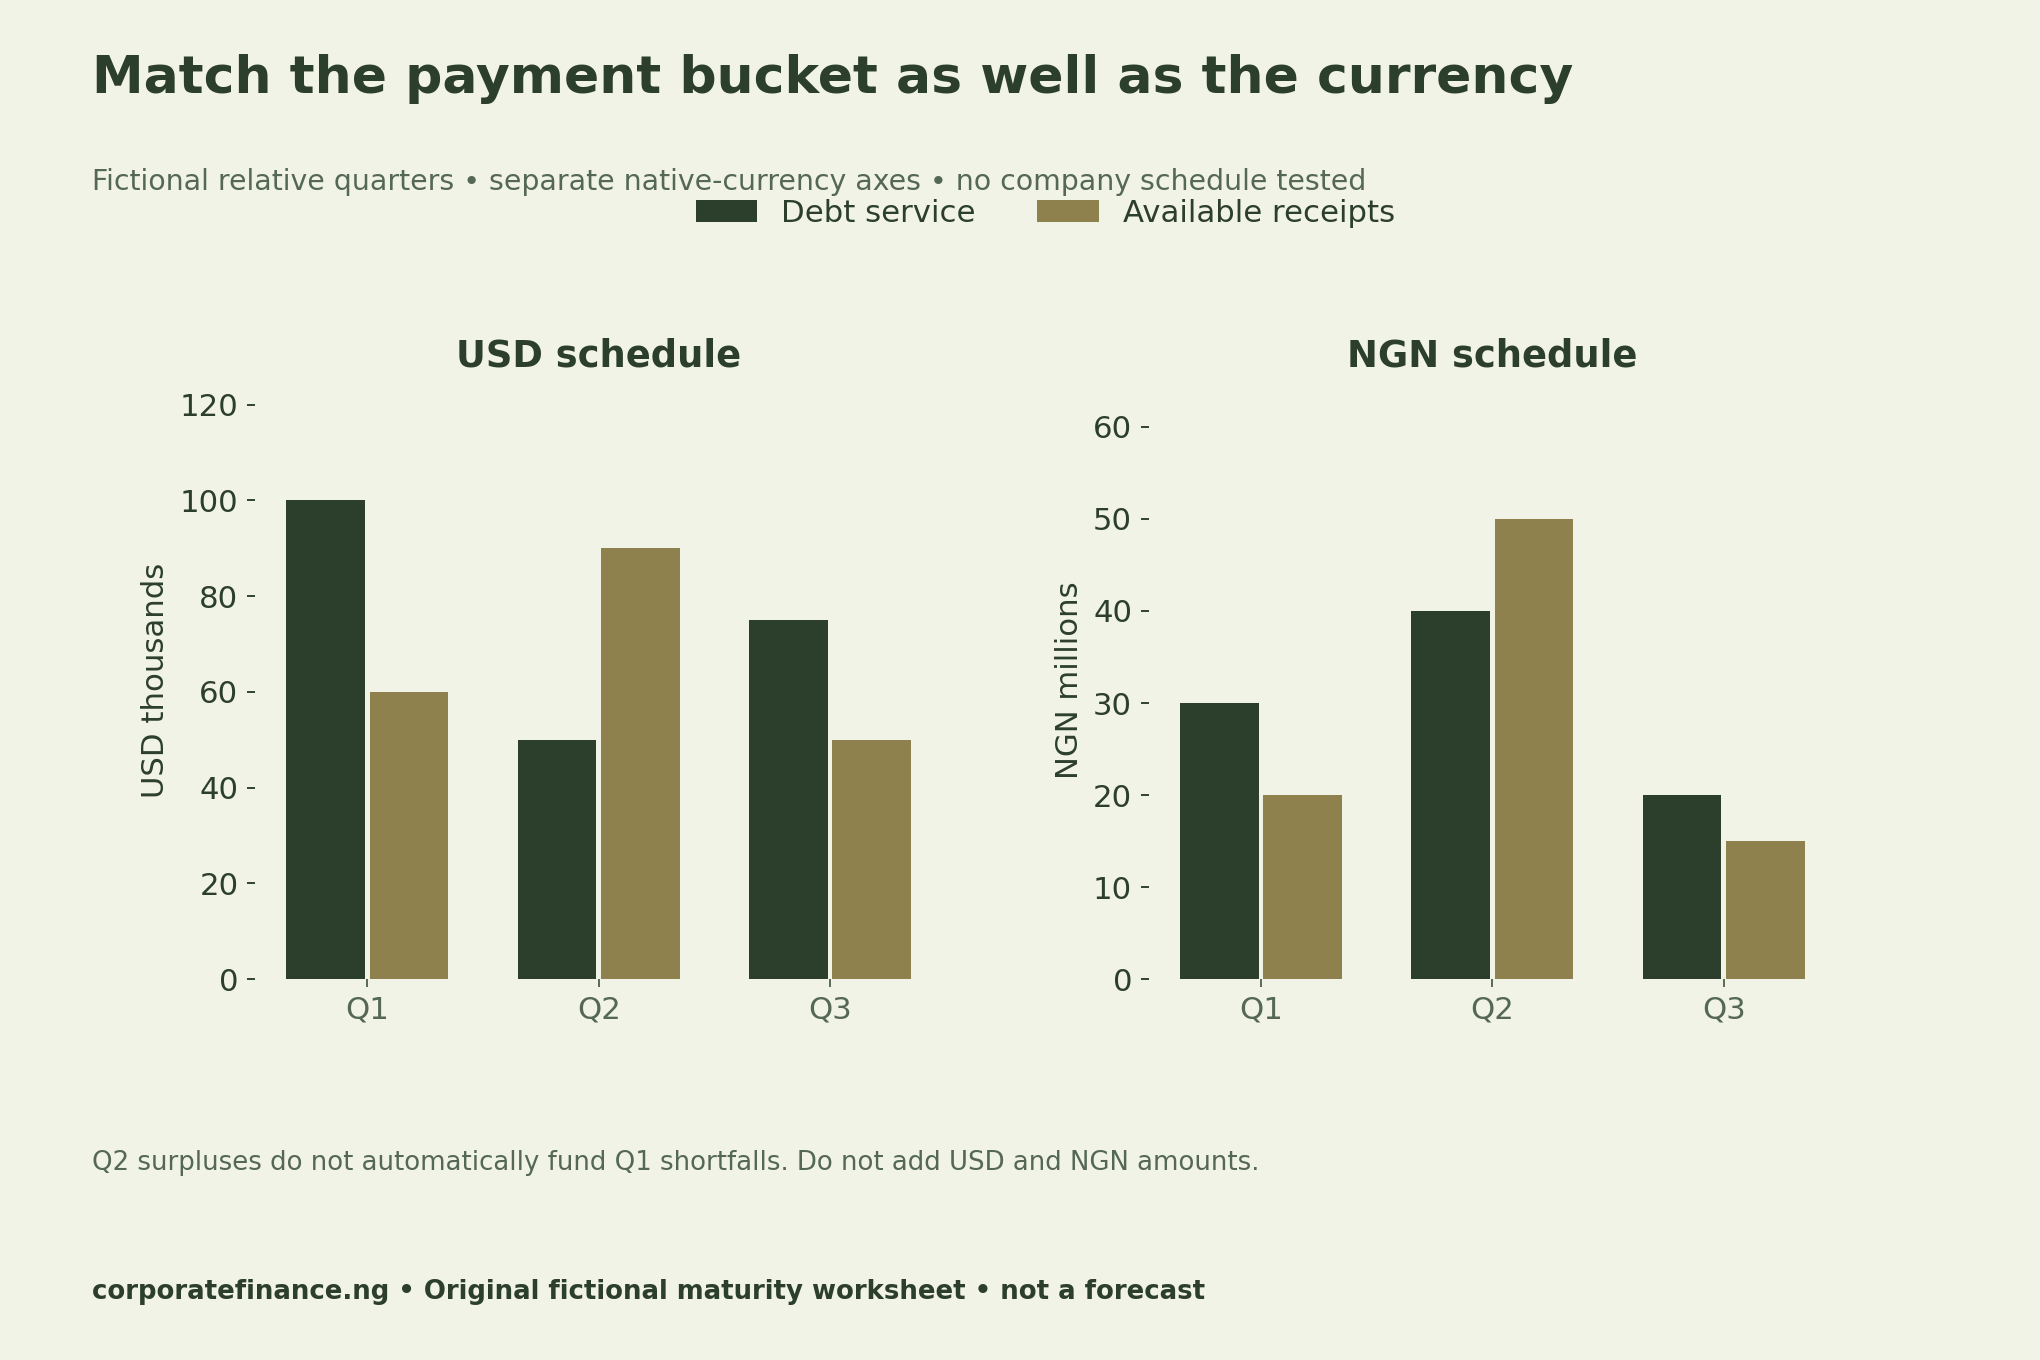
In the fictional USD schedule, Q1 has a 40,000-unit shortfall. Q2 has a 40,000-unit excess of receipts over debt service. An annual net number would conceal the earlier timing problem. Without evidence of starting cash or another funding action, a later receipt does not pay an earlier obligation.
The NGN panel has its own native-unit schedule. Keep those amounts separate from the USD panel. If an authorised company analysis needs one reporting-currency total, document the translation rates and dates first. Do not add the plotted native figures directly.
Use a six-dimension treasury evidence matrix
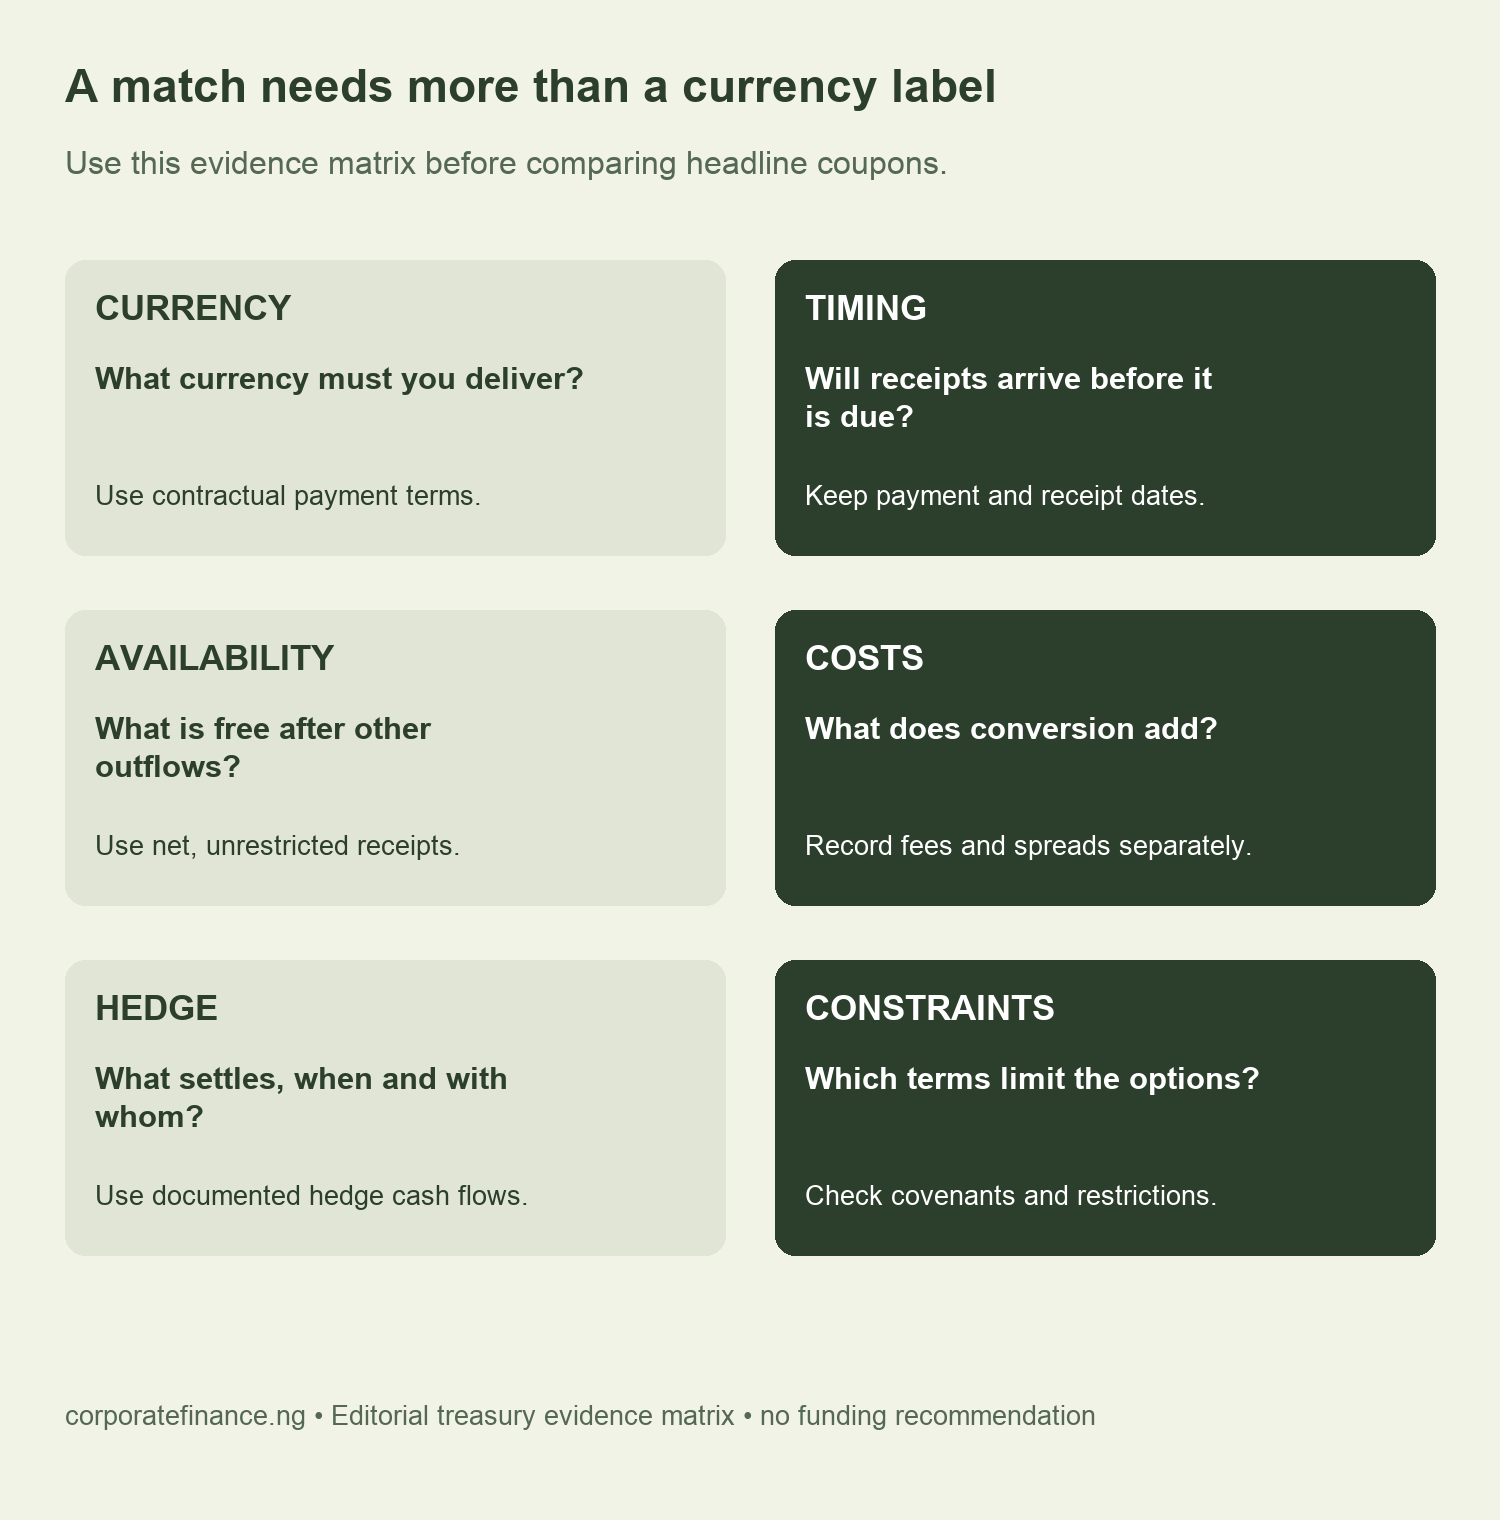
Compare funding only after documenting the full cash-flow schedule and costs. A lower headline coupon can coexist with different currency requirements, timing gaps or other terms. The matrix helps identify missing inputs; it does not rank lenders or recommend a particular loan or derivative.
Download the definitions and fictional worksheets
- Published regional measure definitions (CSV)
- Fictional FX payment sensitivity scenarios (CSV)
- Fictional maturity-by-currency schedule (CSV)
- Blank treasury currency-matching register (CSV)
The definition sheet contains attributed published aggregates only. It does not redistribute the report’s underlying proprietary deal datasets. The scenario and maturity sheets are original fictional calculations. The blank register is a structure for authorised current inputs, with no real company’s private data.
For related measurement checks, see our cash-equivalents analysis and fund NAV reconciliation. Both distinguish an accounting label from available cash evidence.
Methodology, coverage and limits
We retained the OECD’s reported rounded regional measures with their definitions. Annex 3.A describes the bond and syndicated-loan datasets and exclusions. This is market-based coverage, rather than a census of all business borrowing. Its private-credit panel uses assets under management, including undeployed capital; do not reinterpret that panel as cash already lent to companies.
For the original examples, we fixed debt service at USD 100,000, varied assumed NGN/USD rates and calculated gross translation. A separate calculation subtracts assumed available receipts of USD 60,000 before translating the USD 40,000 gap. Conversion costs and hedge flows are zero assumptions in these examples, not facts about real transactions.
A real assessment needs current contracts, expenses, cash availability, conversion access, restrictions and risk analysis. Receipts may be incomplete or mistimed. No actual company schedule, borrowing product or hedge was tested. Suggested citation: Nigerian Corporate Finance (12 November 2026), “Nigerian Corporate Debt Currency Mismatch: Match Cash and Timing”, original fictional treasury worksheets with regional context from OECD, Africa Capital Markets Report 2026, Chapter 3.


