







The Cardinal Torch commercial paper maturity schedule for 2027 contains three identified redemptions: 13 January, 13 April and 16 July. Together, their face value is ₦9,415,391,000. July accounts for 67.90% of that amount. This is a concentrated cash-planning requirement, not evidence that the issuer will fail to repay.
The NGX’s fresh 3 November 2026 listing bulletin gives the inputs for a reproducible maturity ladder. The papers were issued on 17 July 2026. Their November listing does not mean new proceeds arrived in November. We separate face obligations, original discounted values and the larger programme ceiling throughout this educational treasury case study.
Research checked on 8 November 2026. The analysis covers only the three series in the bulletin. It is not an investment recommendation, a complete issuer debt schedule or a credit assessment.
Reconstruct the Cardinal Torch commercial paper maturity schedule
The NGX Regulation bulletin dated 3 November identifies Series 1, 2 and 3, their issue date, maturity dates, face amounts and discounted values. All three redeem at par. The ₦30 billion programme is a framework ceiling; it is not the amount raised by these three issues or a committed refinancing facility.
| Series / symbol | Maturity | Face value (₦) | Discounted value (₦) |
|---|---|---|---|
| Series 1 / CTCL27CPS1 | 2027-01-13 | 1,759,181,000.00 | 1,594,093,943.97 |
| Series 2 / CTCL27CPS2 | 2027-04-13 | 1,263,027,000.00 | 1,081,092,464.19 |
| Series 3 / CTCL27CPS3 | 2027-07-16 | 6,393,183,000.00 | 5,137,856,782.76 |
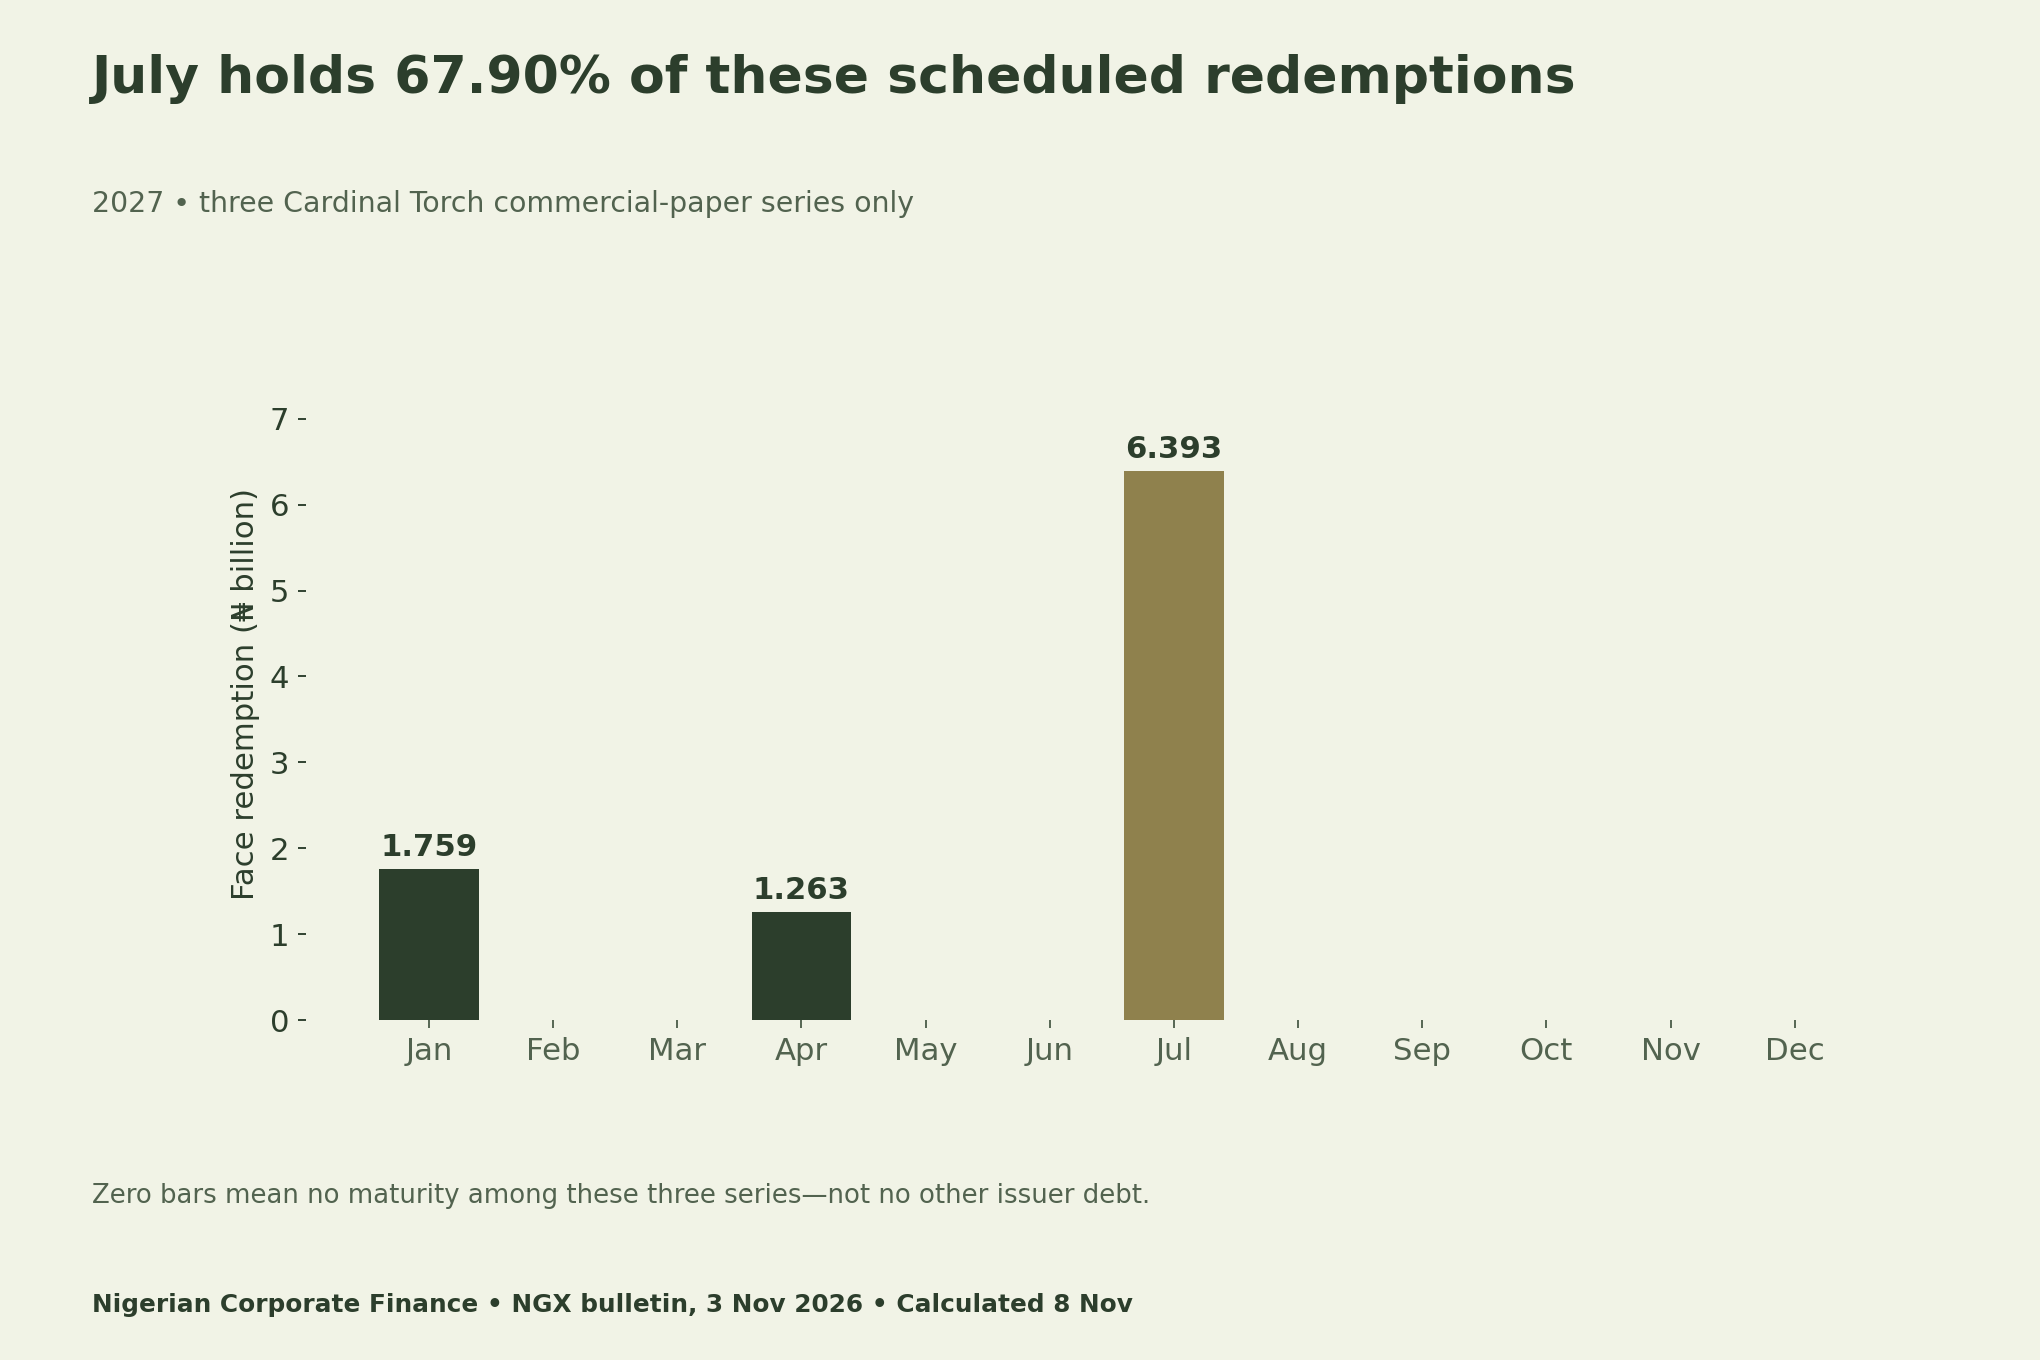
Add the face amounts separately from the discounted values. The three face amounts total ₦9.415391 billion. Series 3 contributes ₦6.393183 billion, or 67.90% after rounding to two decimal places. A treasury team would therefore ask what documented funding sources are available at that July maturity. The bulletin alone cannot answer that question.
Face value is not the original discounted value
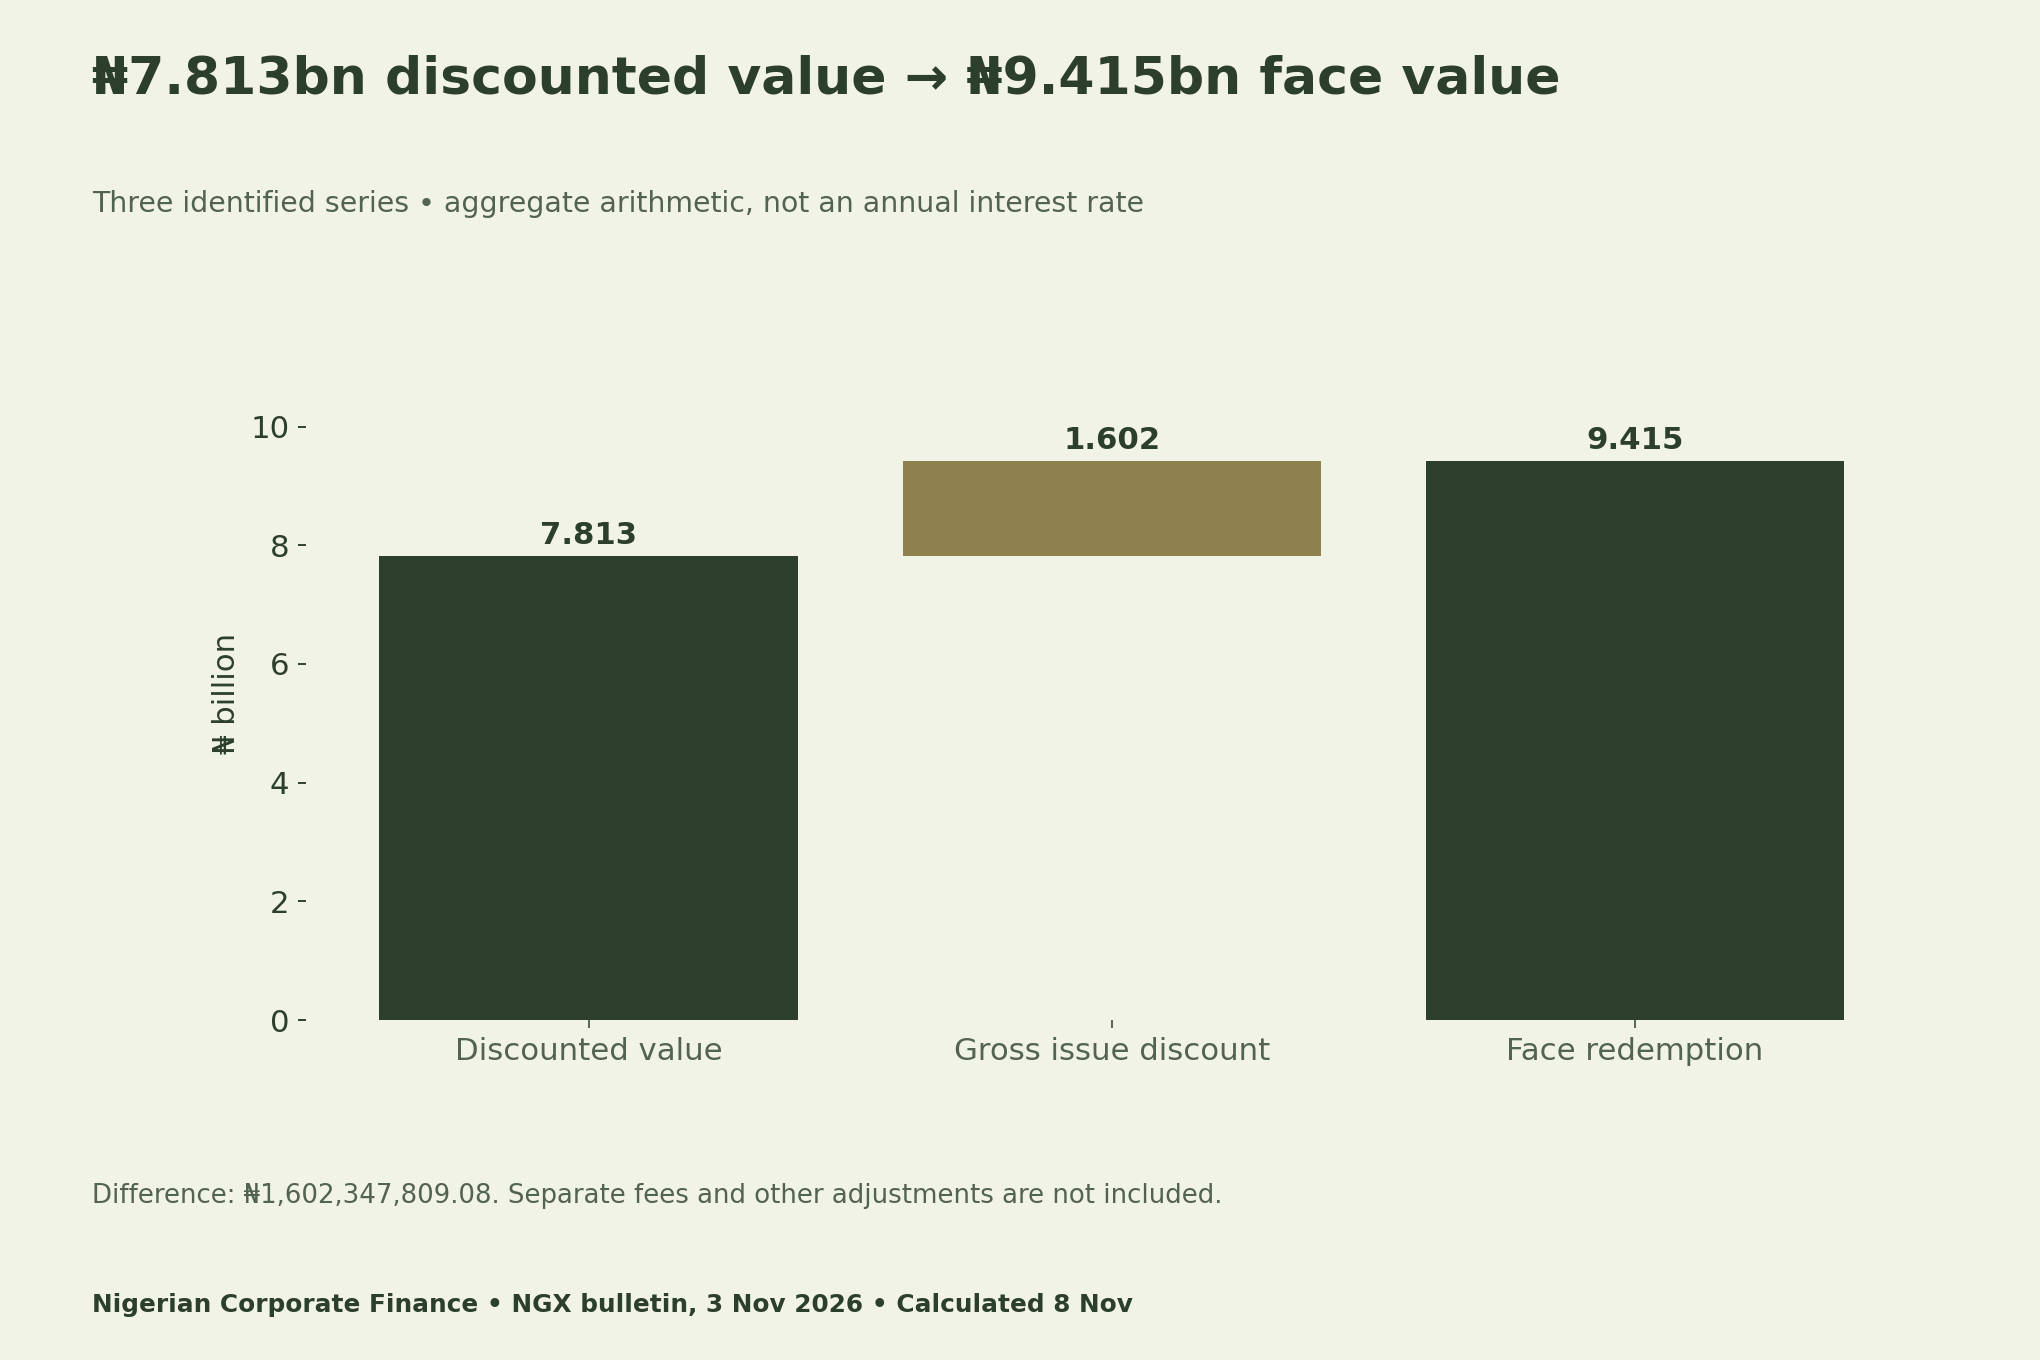
The three discounted values total ₦7,813,043,190.92. Subtracting that total from face value gives ₦1,602,347,809.08. This is the aggregate gross issue discount on the disclosed amounts, before separate fees or other adjustments. It is not a single annual interest rate across instruments with different tenors.
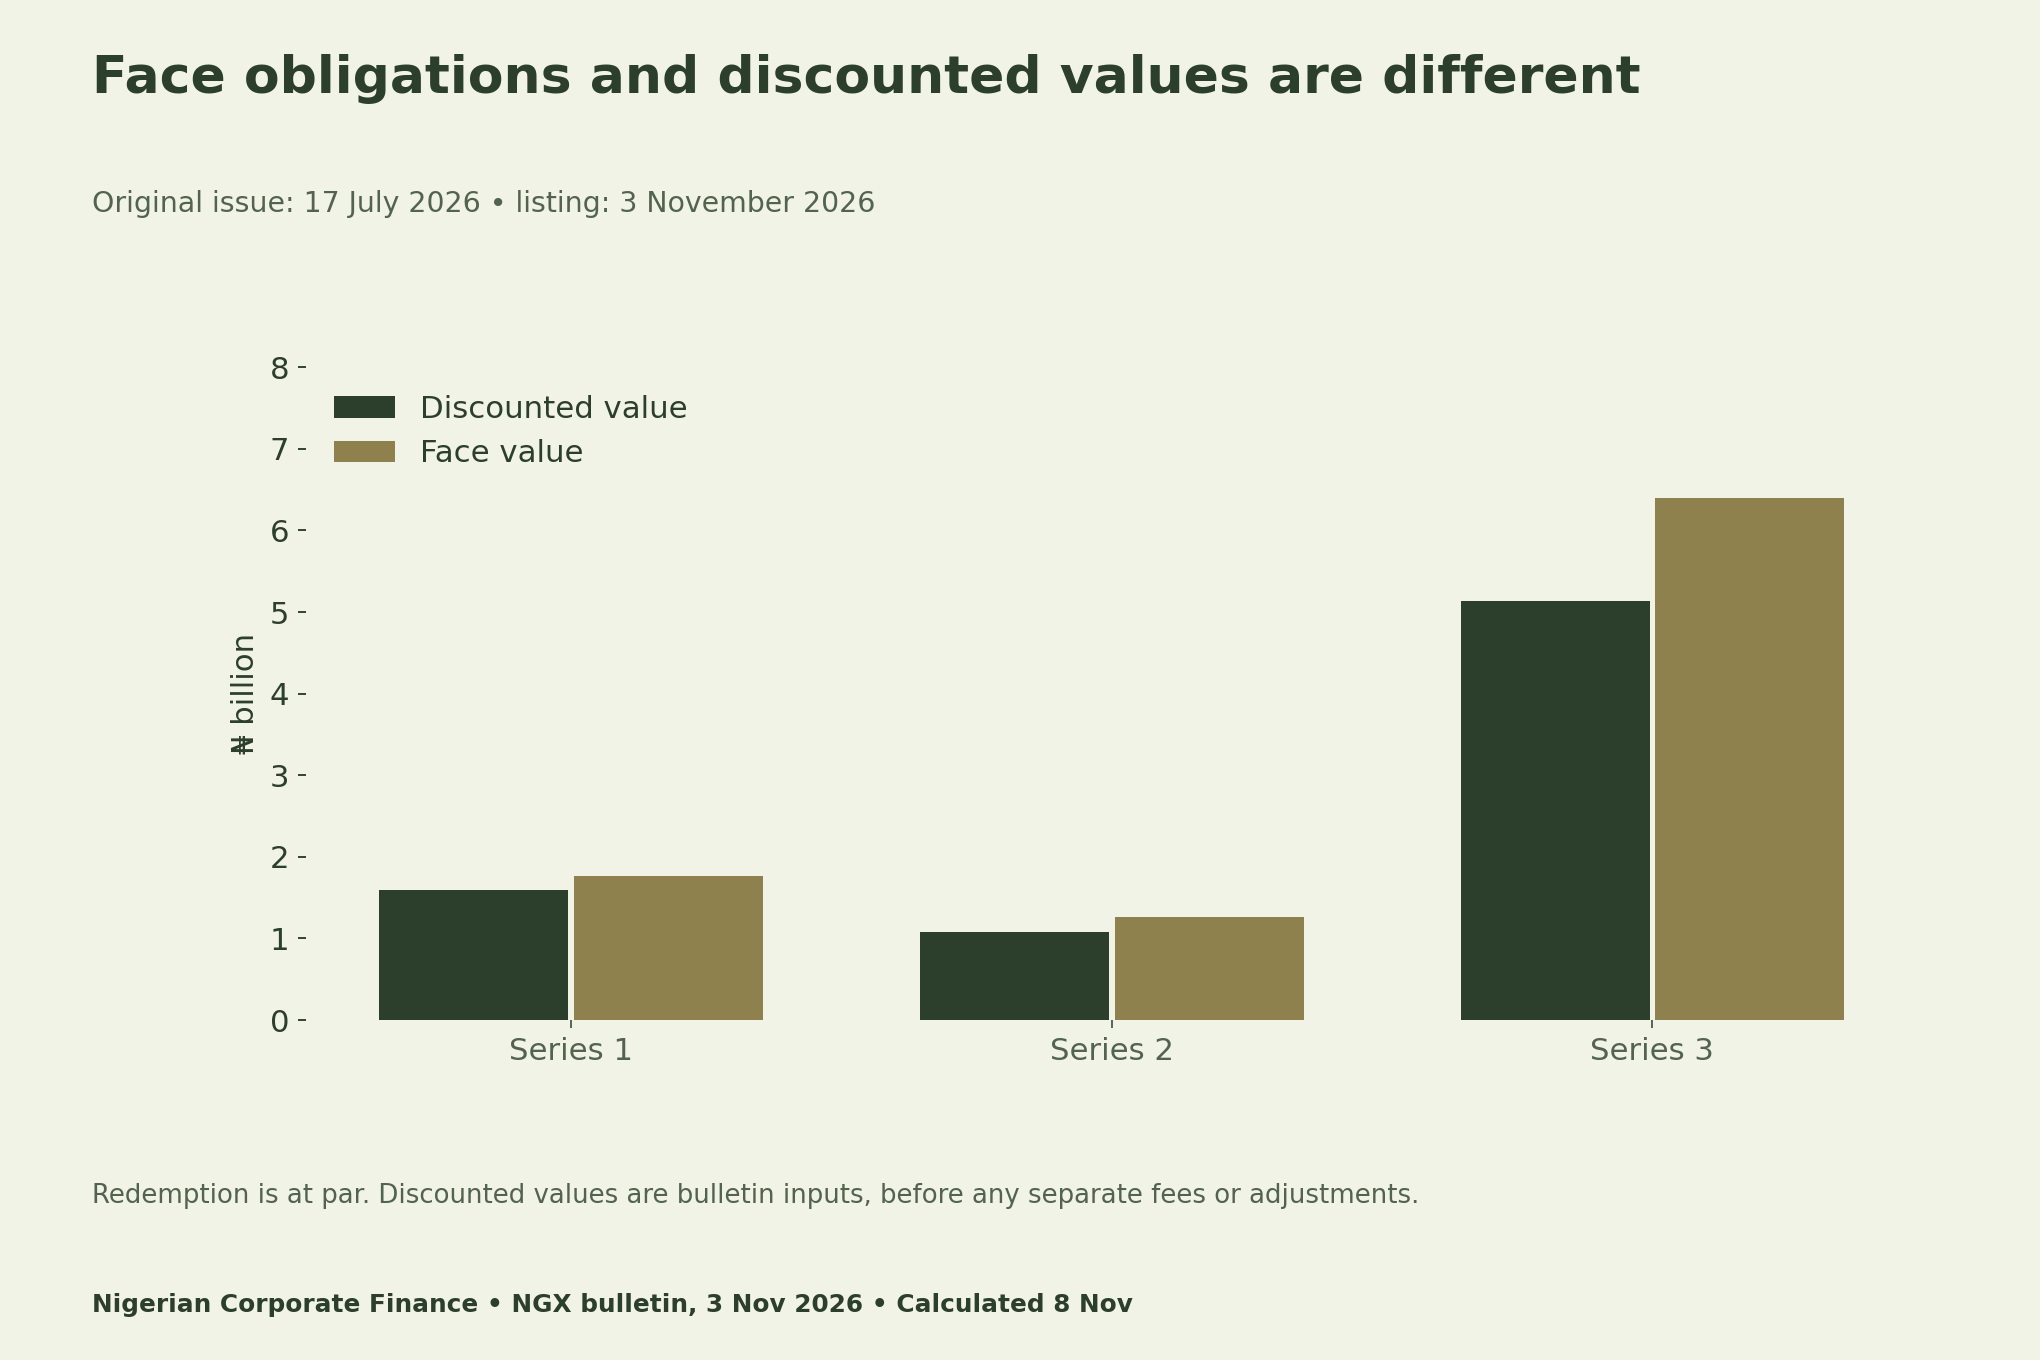
For example, a funding paper might describe the face amount as the redemption requirement while retaining the discounted amount in the original funding record. Do not label both columns “cash raised”. Fees may alter the net cash actually available to the issuer, and the bulletin is not a bank-statement reconciliation.
Read the repayment calendar as a sequence
The first scheduled maturity is ₦1.759181 billion on 13 January 2027. Adding April brings the cumulative face obligation to ₦3.022208 billion. July then brings the three-series total to ₦9.415391 billion. This cumulative view helps prevent a later, larger maturity from obscuring earlier requirements.
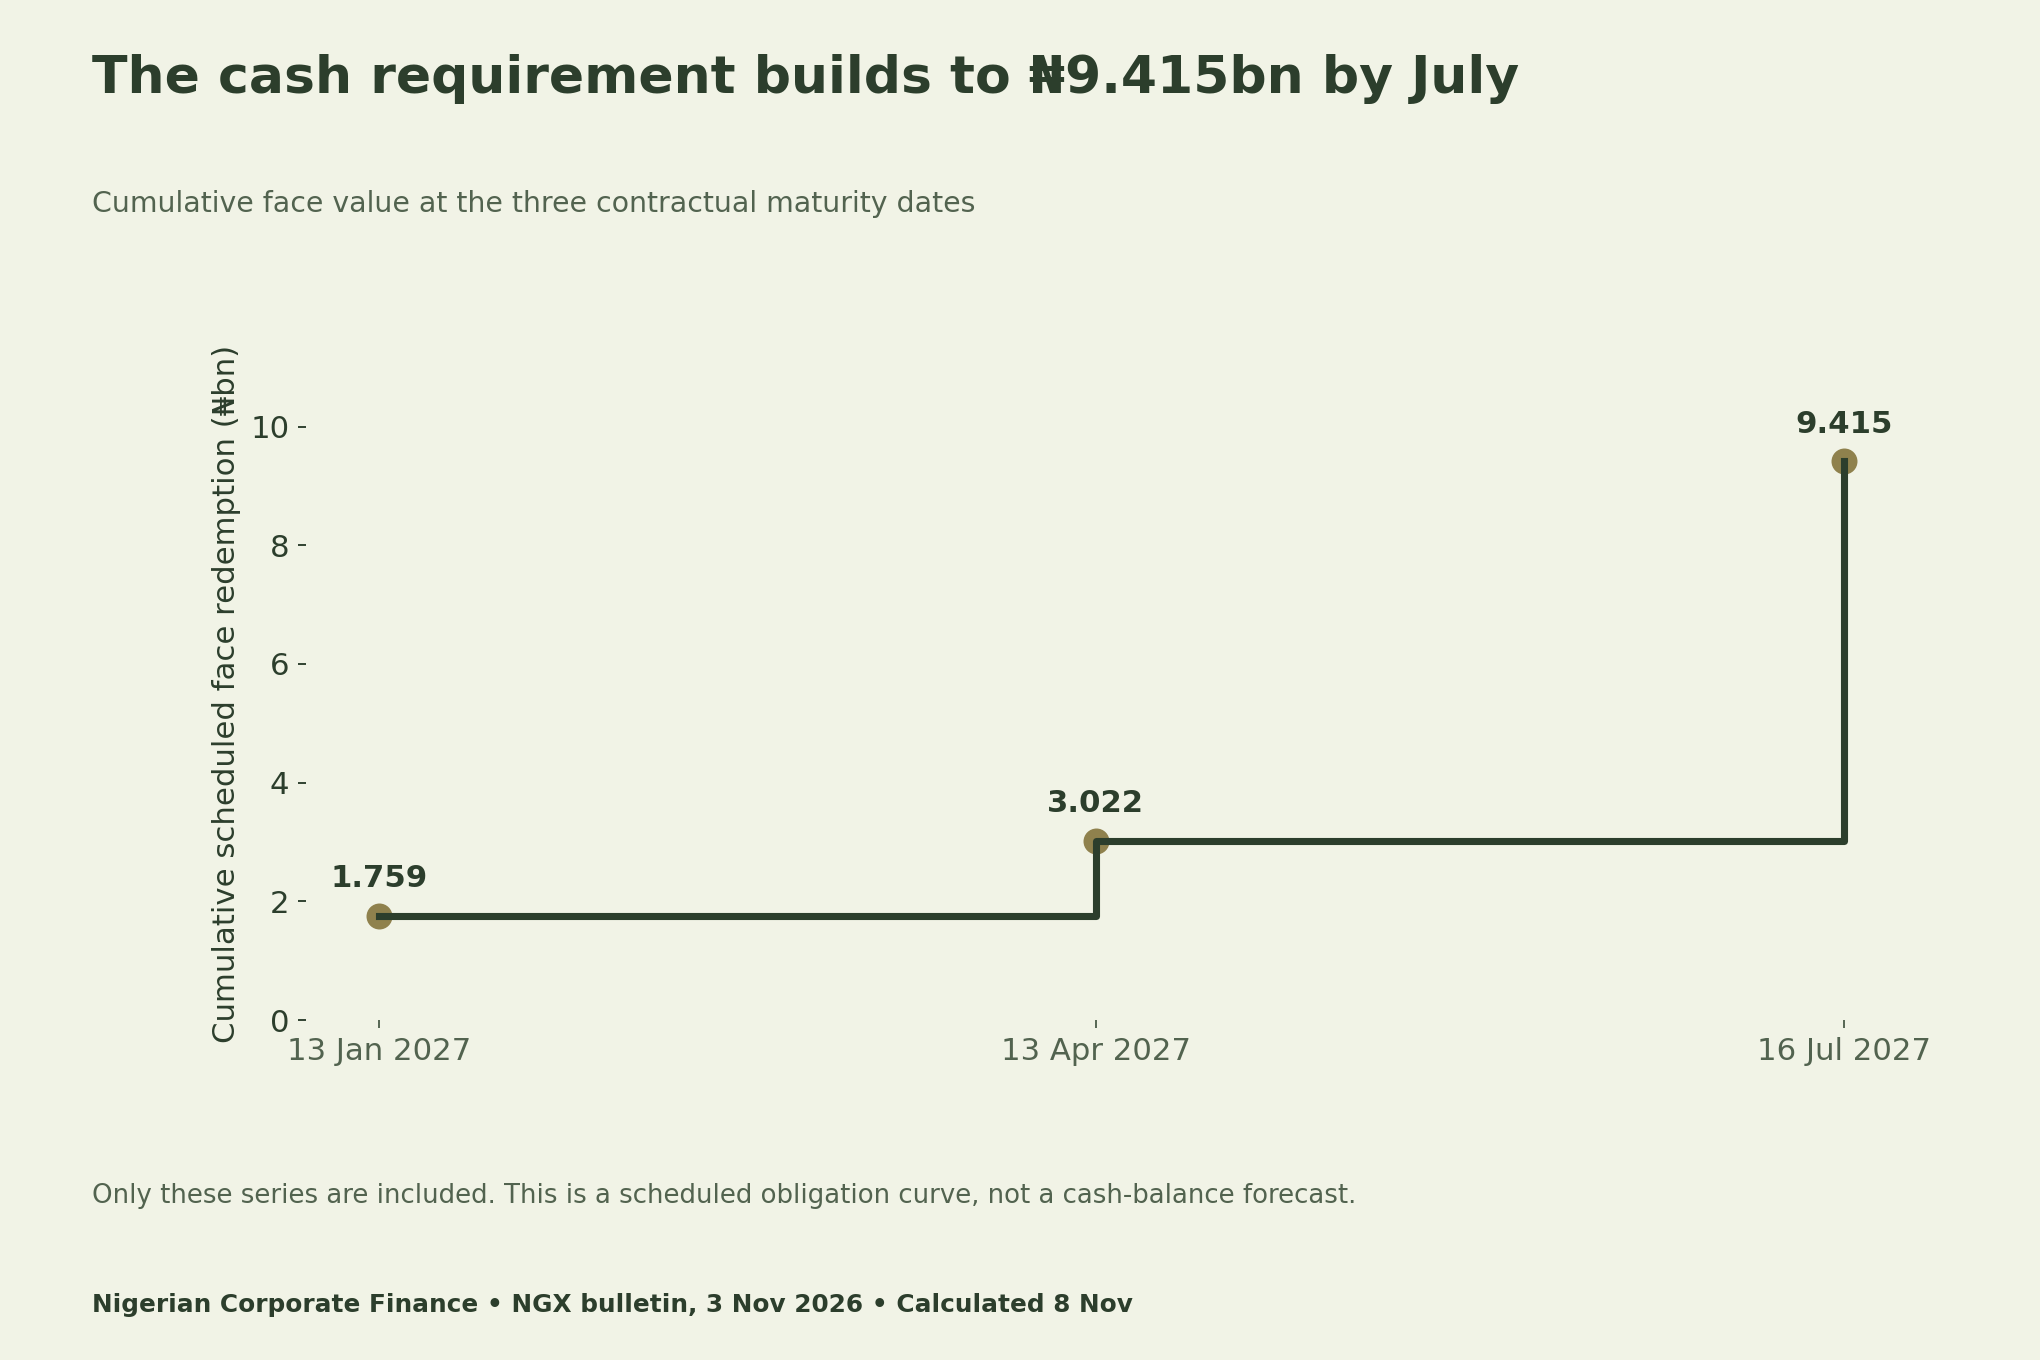
A maturity ladder should use stable identifiers such as CTCL27CPS1, CTCL27CPS2 and CTCL27CPS3. Keep the source date and instrument terms alongside each row. If a later official document changes the schedule, retain the earlier version and explain the change. Do not silently mix issue dates, listing dates and maturity dates.
Build a funding-gap scenario with evidence
Start with the face requirement at each maturity. Then identify verified earmarked cash and documented operating cash available by that date. Leave an undisclosed input blank rather than substituting zero. A blank means the evidence is unavailable here; a zero would be a specific numerical assertion.
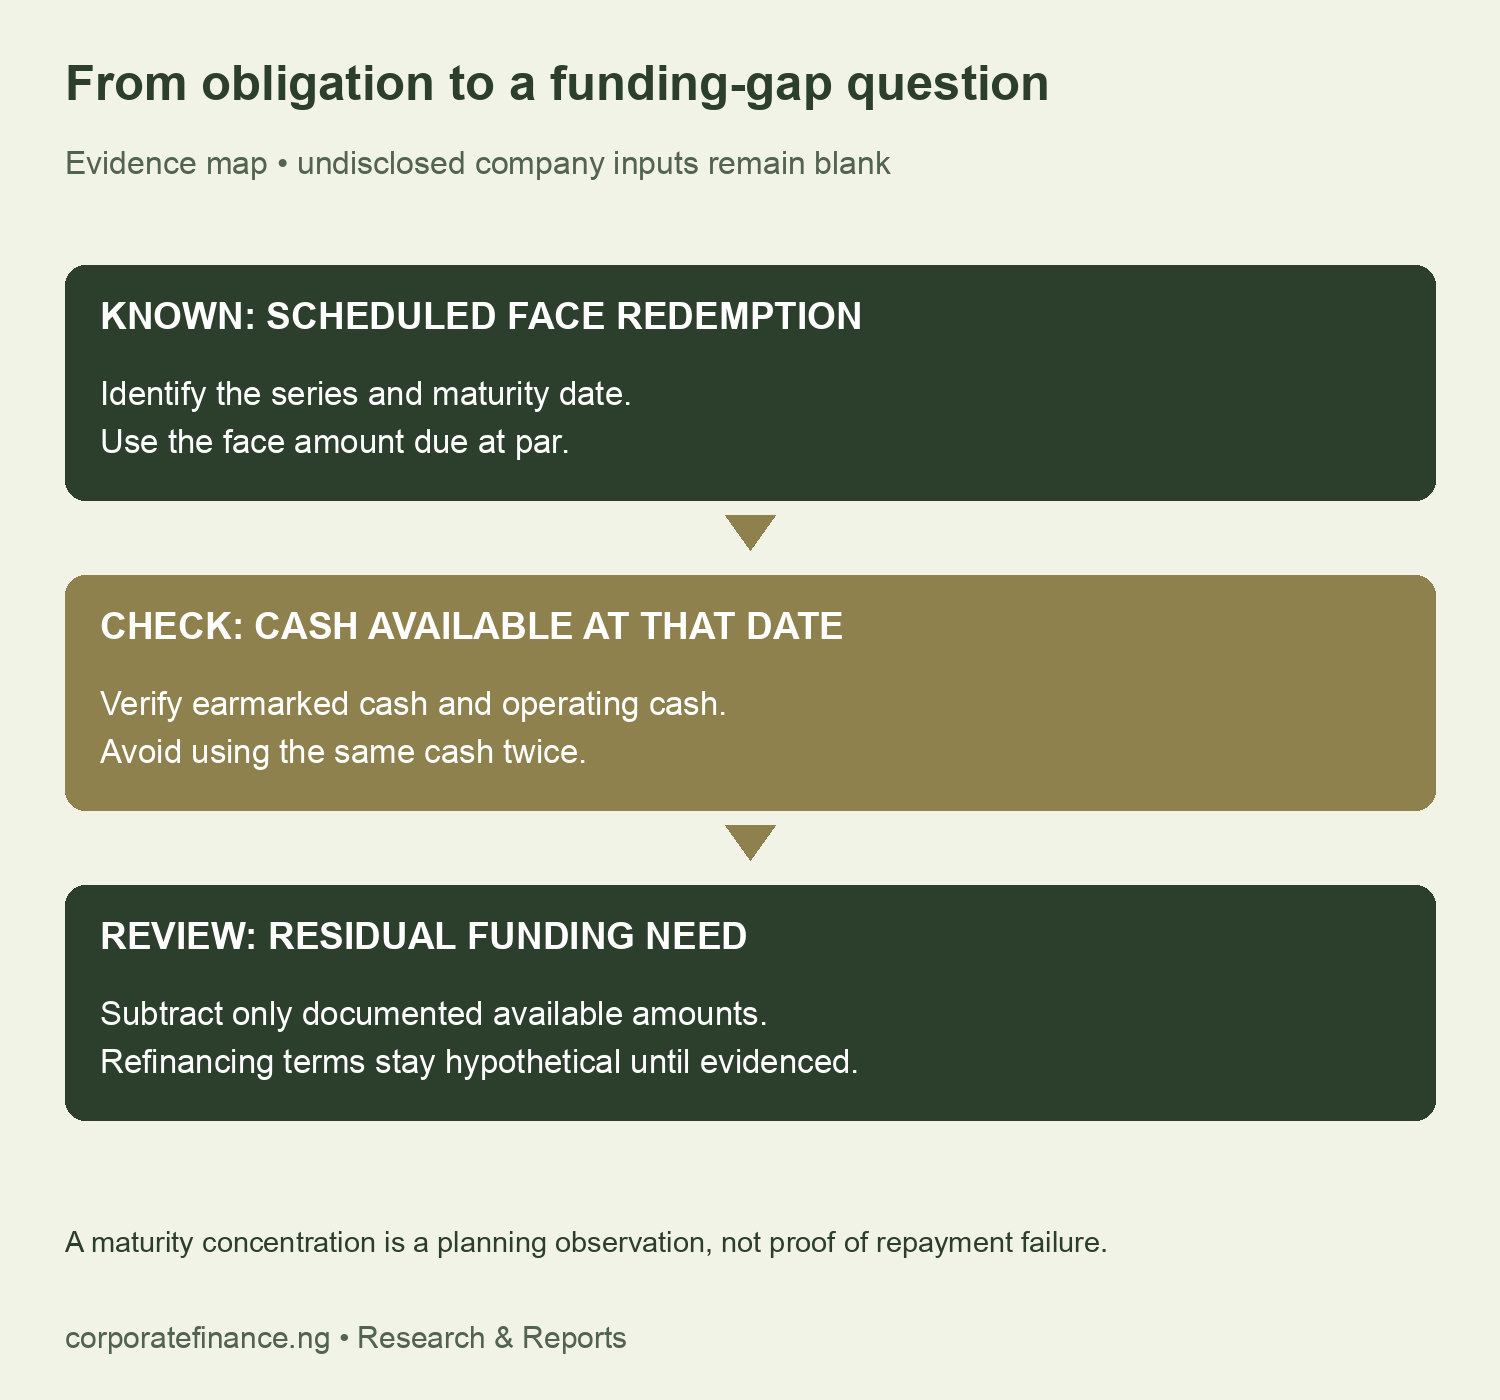
For a user-built scenario, residual need equals scheduled redemption less verified earmarked cash less documented operating cash available. Keep sources, dates and owners beside those inputs. Also check that cash has not been counted against two maturities or assumed available despite another restriction. The downloadable scenario sheet intentionally leaves those issuer-specific fields empty.
Refinancing is another evidence question. A programme ceiling does not establish an undrawn committed facility, lender approval or a rollover on acceptable terms. If you test a hypothetical refinancing rate, label it as your assumption and state its date and currency. Do not present that exercise as an observed funding arrangement.
Keep the funding-cost bridge separate from a rate claim
The bulletin gives tenors of 180, 270 and 364 days. Series 3 also has the largest face amount. Its larger naira discount therefore cannot, by itself, tell you which instrument has the highest comparable annual all-in cost. A proper comparison needs consistent rate definitions, day-count treatment and separately evidenced fees.
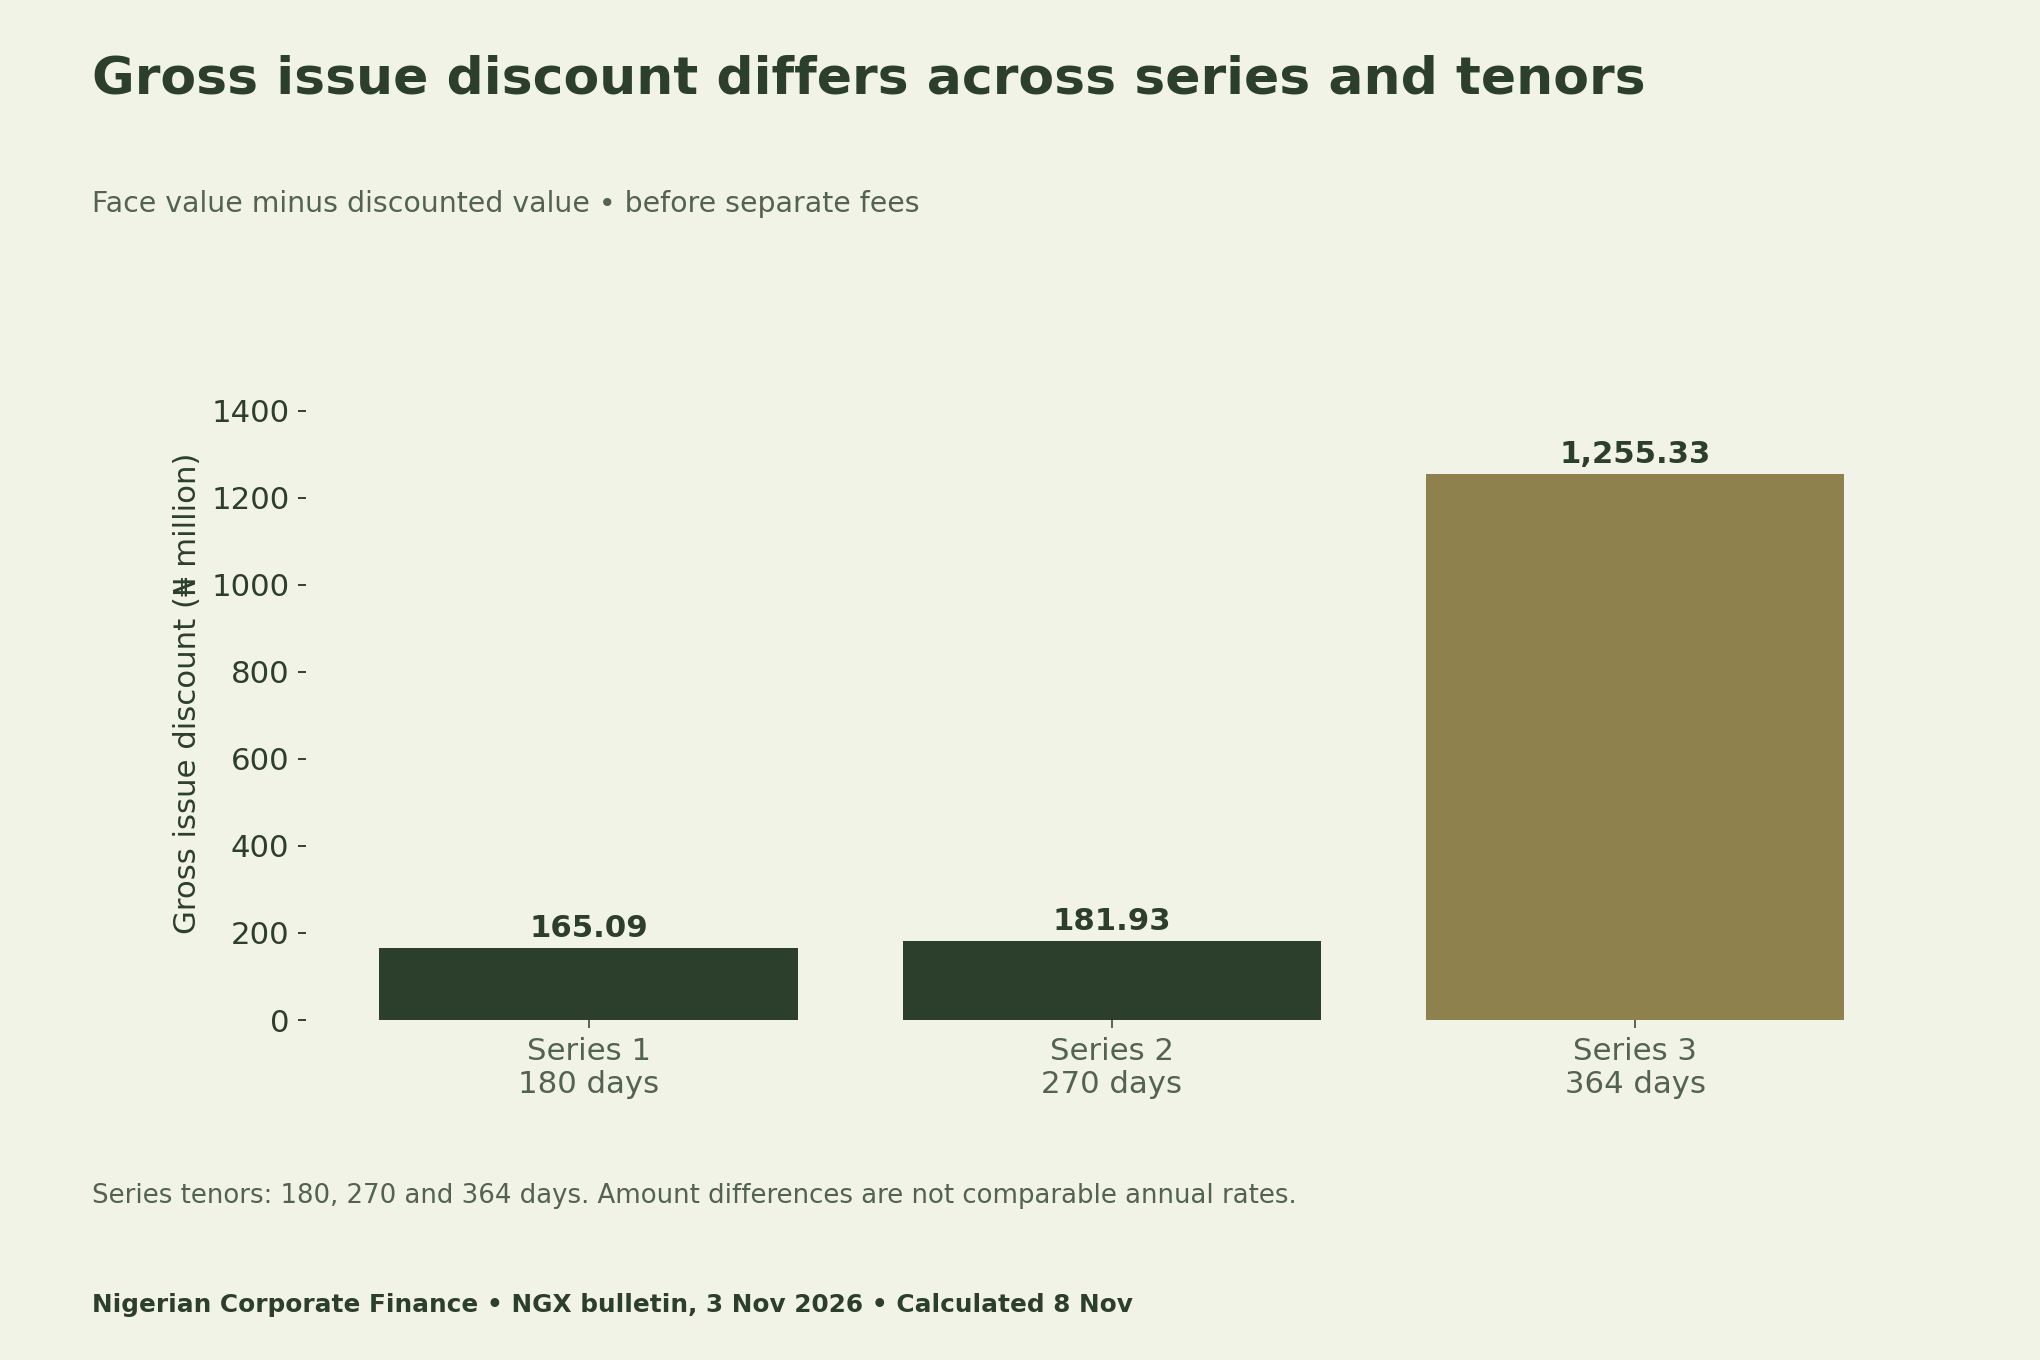
Our bridge file preserves the gross discount and leaves fee, adjustment and day-count fields for a documented analysis. It does not fill missing terms with a market average. Our corporate-bond structuring guide provides broader funding context, while the cash-definition research explains why a reported cash label needs careful reconciliation.
Download the maturity and planning files
The source ladder contains exact naira amounts and instrument identifiers. The monthly file is a twelve-month schedule for these three series only. The funding-gap and cost-bridge worksheets are editable planning aids, with undisclosed inputs left empty. They are not completed company forecasts or validated credit models.
- Three-series maturity ladder and source fields (CSV)
- Monthly scheduled redemptions for these series (CSV)
- Blank evidence-based funding-gap scenario worksheet (CSV)
- Gross discount to all-in-cost bridge worksheet (CSV)
Methodology, limitations and citation
We transcribed page 1 of NGX bulletin NGXREG/IRD/MB120/26/11/3 and used decimal arithmetic for the totals and differences. The concentration calculation is Series 3 face value divided by the three-series face total, multiplied by 100. Chart values in billions and millions are display conversions; the source-data CSV preserves precision.
The bulletin does not disclose current cash reserves, the full debt book, subsequent funding, secondary-market liquidity or a complete cash-flow forecast. No company was contacted and no confidential treasury records were accessed. A maturity concentration is a planning observation, not proof of distress, default, solvency or a particular credit outcome.
Suggested citation: Nigerian Corporate Finance (8 November 2026), “Cardinal Torch Commercial Paper: The 2027 Maturity Schedule”, calculations from the NGX Regulation bulletin dated 3 November 2026. Retain the three-series coverage and distinguish face amounts from discounted values when reusing the analysis.


