




Our First HoldCo 9M 2026 earnings quality analysis starts with a clear contrast. Consolidated Group profit after tax rose 65.1%, from ₦450.868bn to ₦744.450bn. Yet net interest income fell 16.0%, from ₦1,500.578bn to ₦1,260.129bn. A complete earnings bridge explains how both can be true.
The bridge attributes the change across all reported pre-tax components. It does not turn one period’s results into a forecast or a subjective quality score. For corporate finance teams, the useful output is a set of separate forecasting questions, supported by exact source data.
Research checked on 27 October 2026. We use the NGX-hosted First HoldCo filing numbered 48134. Its board-approval text states 23 October 2026. These are unaudited results for the nine months ended 30 September, not October income.
First HoldCo 9M 2026 earnings quality analysis: fix the scope
The income statement on PDF page 5, printed page 4, has both discrete Q3 and cumulative year-to-date columns. We use the two year-to-date Group columns. Parent Company results, quarterly results and First Bank alone are different reporting scopes. Nor is the consolidated Group a Nigeria-only dataset.
All source amounts are in naira millions. We divide by 1,000 for the billion-naira figures below. Net fees rose from ₦213.694bn to ₦316.429bn, or 48.1%. Meanwhile, pre-tax profit rose from ₦566.537bn to ₦911.241bn, or 60.8%. Those measures belong to different earnings layers.
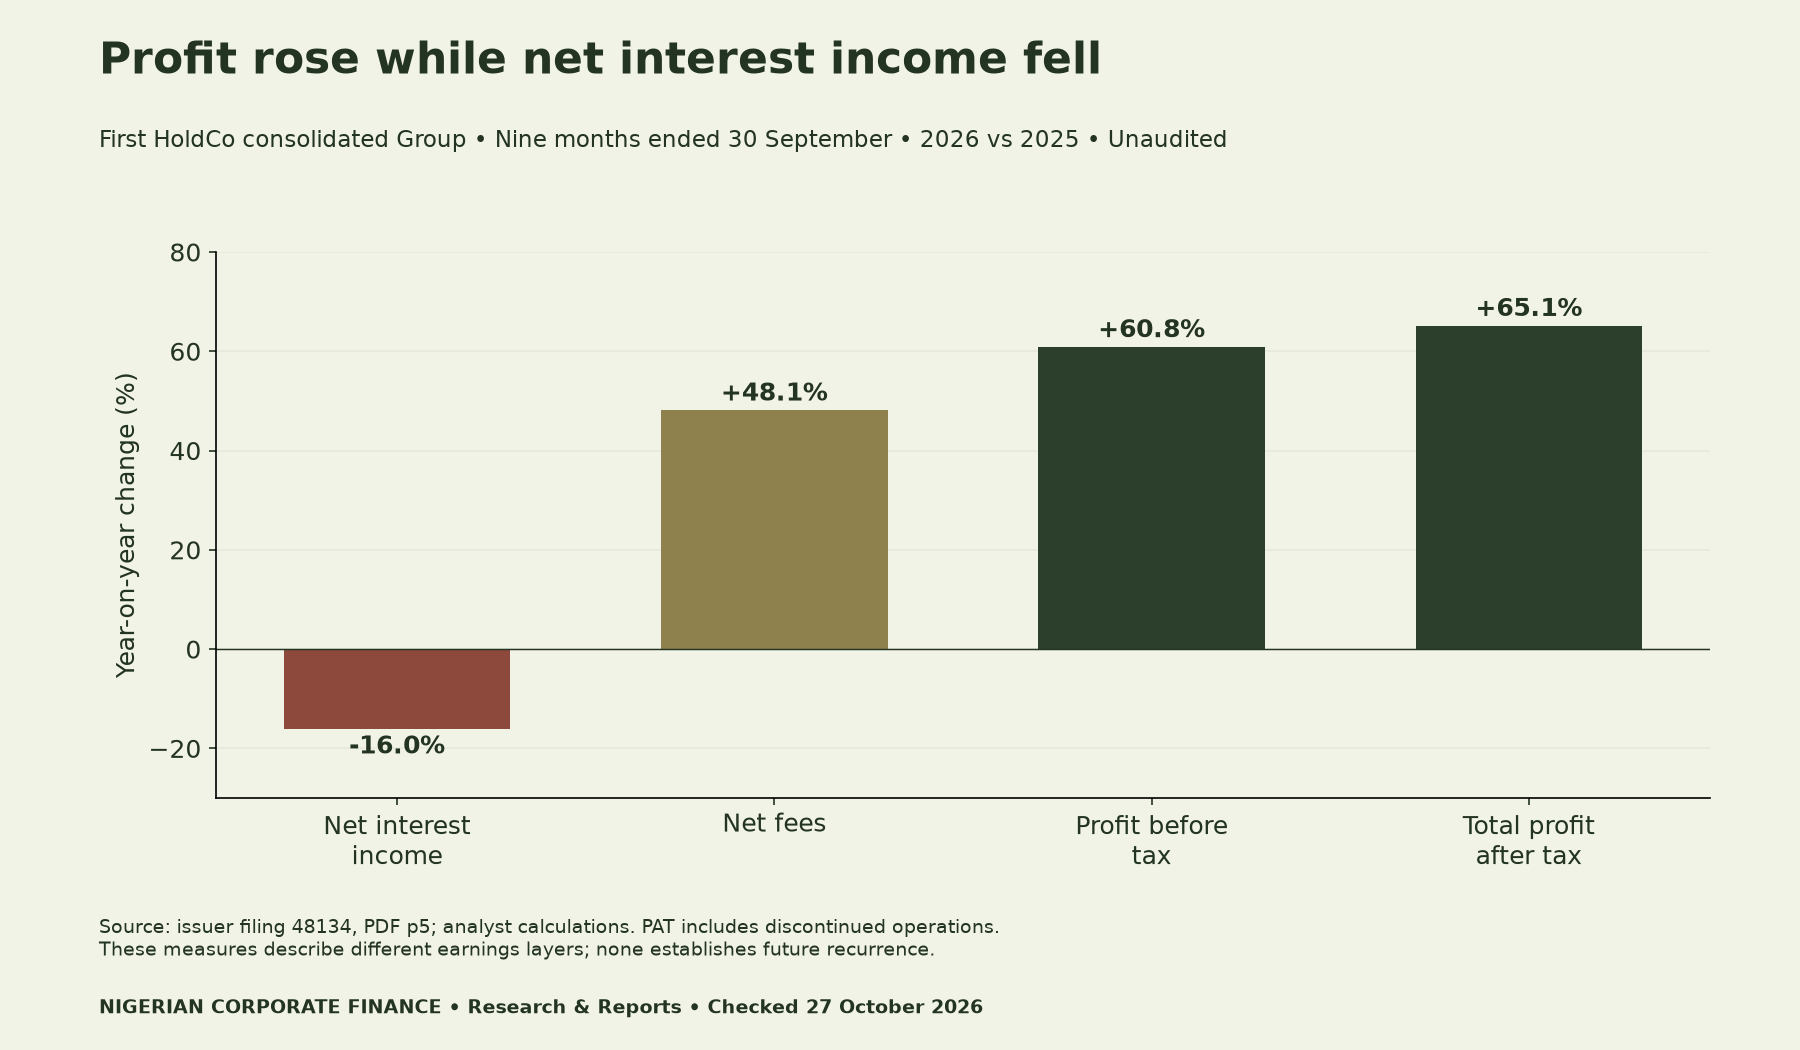
Total profit after tax includes the discontinued-operation result. We therefore build the main bridge to continuing pre-tax profit first, then show tax and discontinued operations separately. That order prevents their movements from being attributed to lending or fee income.
Every component of the pre-tax bridge
Net interest income contributes −₦240.449bn to the year-on-year change. However, a lower impairment charge contributes +₦81.823bn and higher net fees contribute +₦102.735bn. These are profit effects: a smaller expense increases profit even though the charge itself remains negative.
| Signed Group component (₦bn) | 9M 2025 | 9M 2026 | Profit effect |
|---|---|---|---|
| Net interest income | 1,500.578 | 1,260.129 | -240.449 |
| Impairment charge | -288.919 | -207.096 | +81.823 |
| Net fee and commission income | 213.694 | 316.429 | +102.735 |
| Foreign exchange gains | 71.943 | 86.242 | +14.299 |
| Investment-security sale gains | 48.492 | 61.121 | +12.629 |
| FVTPL net gains or losses | -72.779 | 104.588 | +177.367 |
| Dividend income | 11.740 | 12.488 | +0.748 |
| Other operating income | 23.832 | 142.058 | +118.226 |
| Personnel expenses | -290.650 | -280.833 | +9.817 |
| Depreciation amortisation impairment | -55.984 | -66.072 | -10.088 |
| Other operating expenses | -596.037 | -519.691 | +76.346 |
| Associate profit | 0.627 | 1.878 | +1.251 |
| Profit before tax | 566.537 | 911.241 | +344.704 |
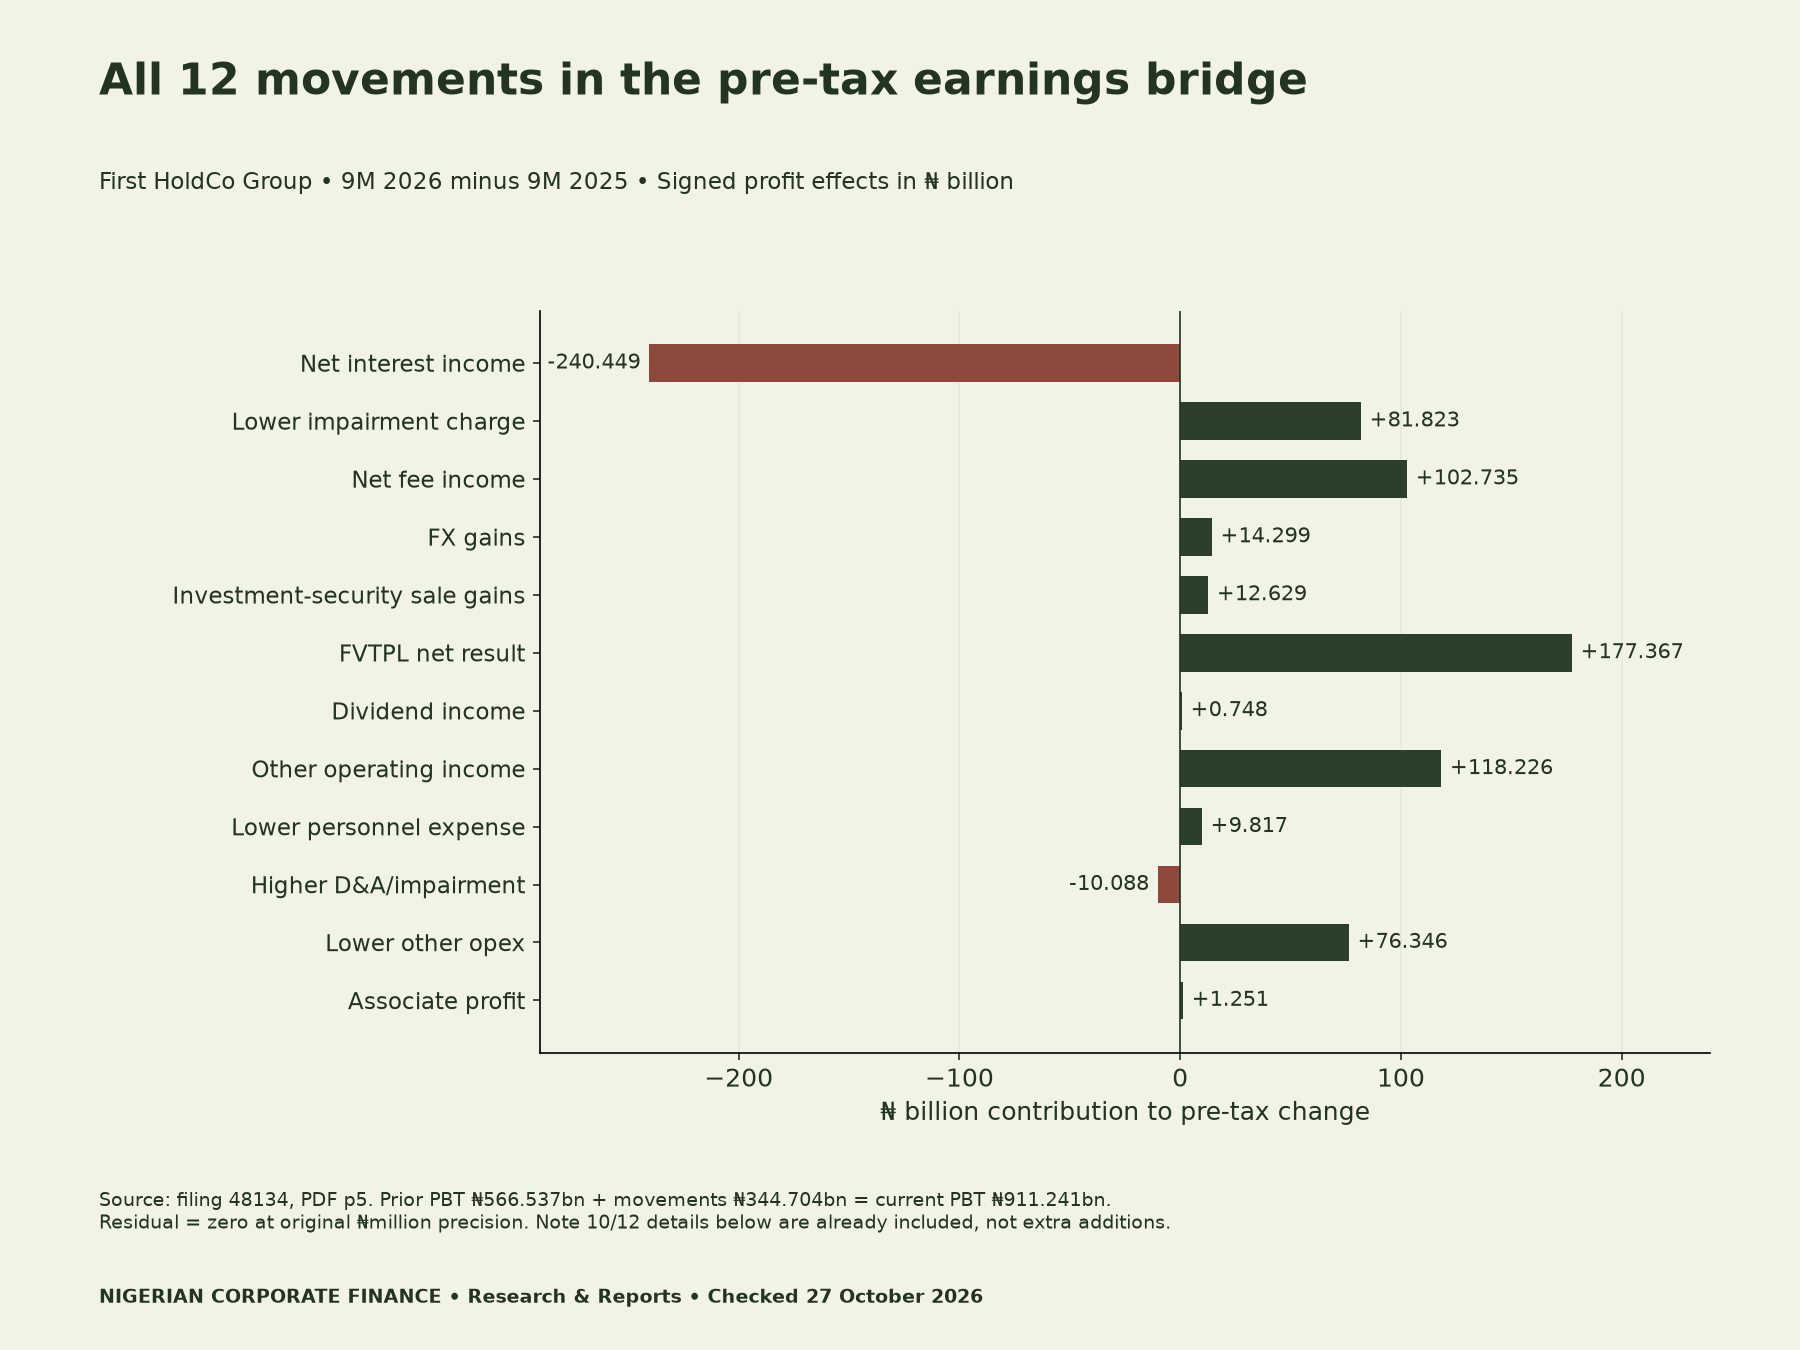
Across all 12 components, the movements sum to ₦344.704bn. Thus, ₦566.537bn + ₦344.704bn = ₦911.241bn. Both annual columns and the change bridge reconcile exactly at the original million-naira precision. We include small components as well as large ones, so the visual does not present a partial explanation as complete.
Other operating income, FVTPL results and net fees are already net or aggregated lines in this bridge. Their supporting-note details must not be added a second time. For another example of this control, see the Transcorp Power metric-definition audit.
FVTPL gains: inspect the components before forecasting
FVTPL means fair value through profit or loss. The net result moved from a ₦72.779bn loss to a ₦104.588bn gain, contributing +₦177.367bn to the pre-tax change. Note 10, PDF page 32, splits that result into trading gains on debt securities and fair value losses.
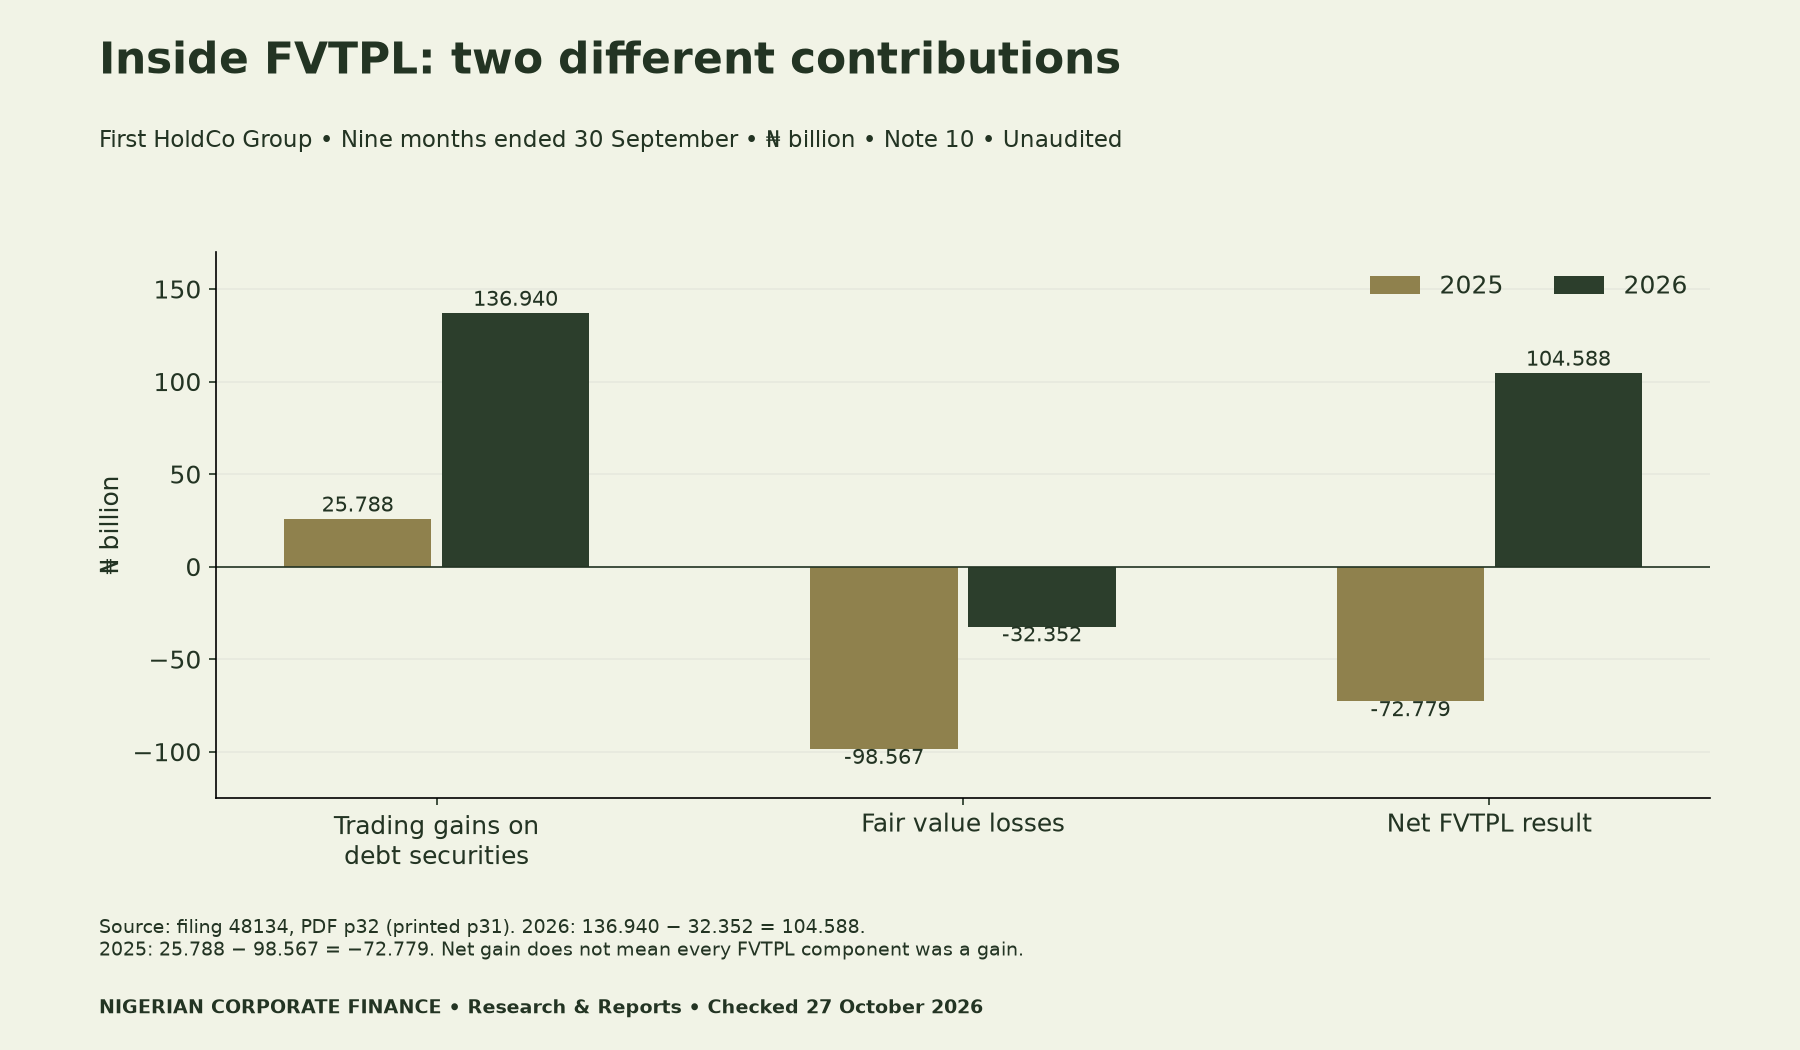
Trading gains rose from ₦25.788bn to ₦136.940bn. Fair value losses narrowed from ₦98.567bn to ₦32.352bn. Consequently, the positive net result does not mean that every underlying component was a gain. Nor does it show that a similar contribution will recur next period.
An analyst should ask for the relevant exposures, realised-versus-valuation detail and sensitivity to market conditions. Separate those assumptions from interest income and customer-service fees. The note supports attribution; further evidence is needed to support a forecast.
Recoveries are part of a larger income line
Other operating income rose from ₦23.832bn to ₦142.058bn. Note 12, PDF page 33, reports recoveries of ₦5.884bn and ₦94.308bn, respectively. The same note also includes gains on property/equipment sales and a separate other-income line.
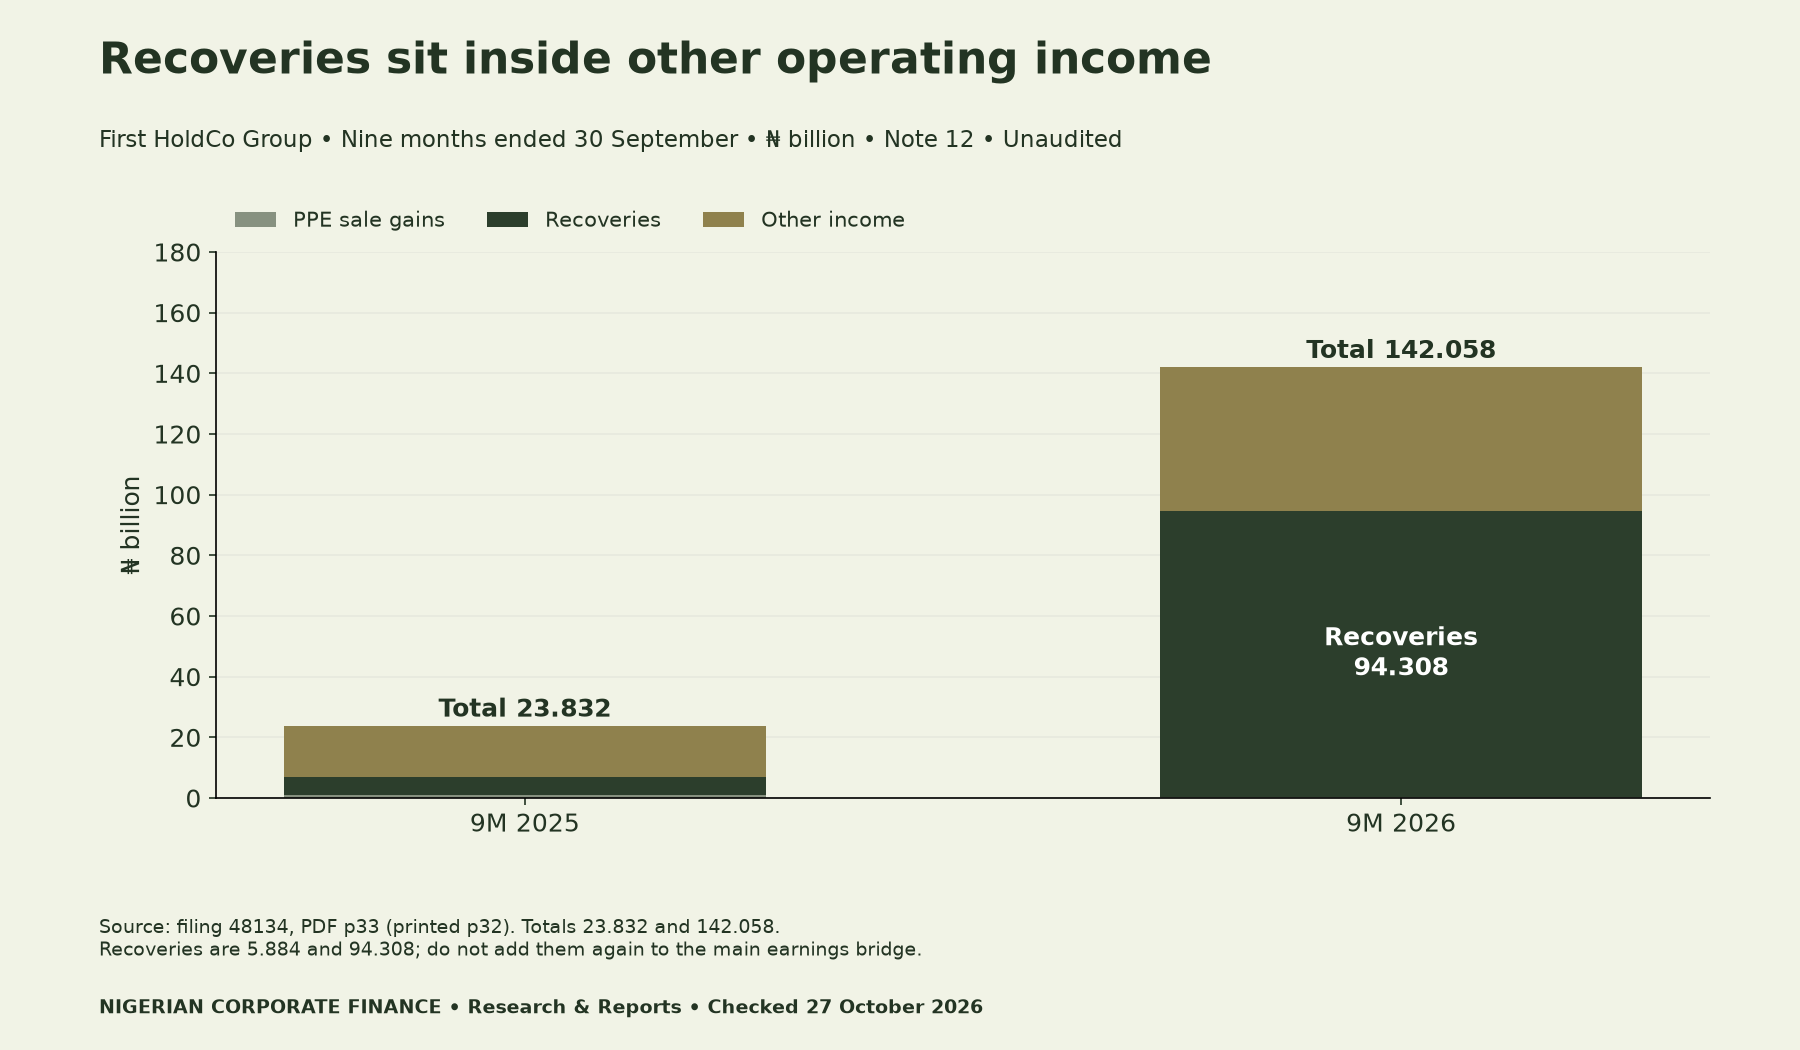
Recoveries increased by ₦88.424bn. Other income increased by ₦30.499bn, while property/equipment sale gains fell by ₦0.697bn. Together these changes equal the ₦118.226bn increase in other operating income. The recovery movement is therefore an explanation within that line, not an additional bridge item.
A larger recovery amount alone cannot establish collection effectiveness. That judgement needs a defined recoverable pool, vintage, costs, timing and comparable outcomes. Similarly, we cannot assume that recoveries are either permanently recurring or wholly exceptional from these two totals.

Tax and discontinued operations explain the final layer
The continuing tax charge rose from ₦108.462bn to ₦166.629bn, a ₦58.167bn increase. The discontinued-operation loss narrowed from ₦7.207bn to ₦0.162bn, adding ₦7.045bn to the total profit change. These adjustments explain why PAT growth differs from pre-tax growth.
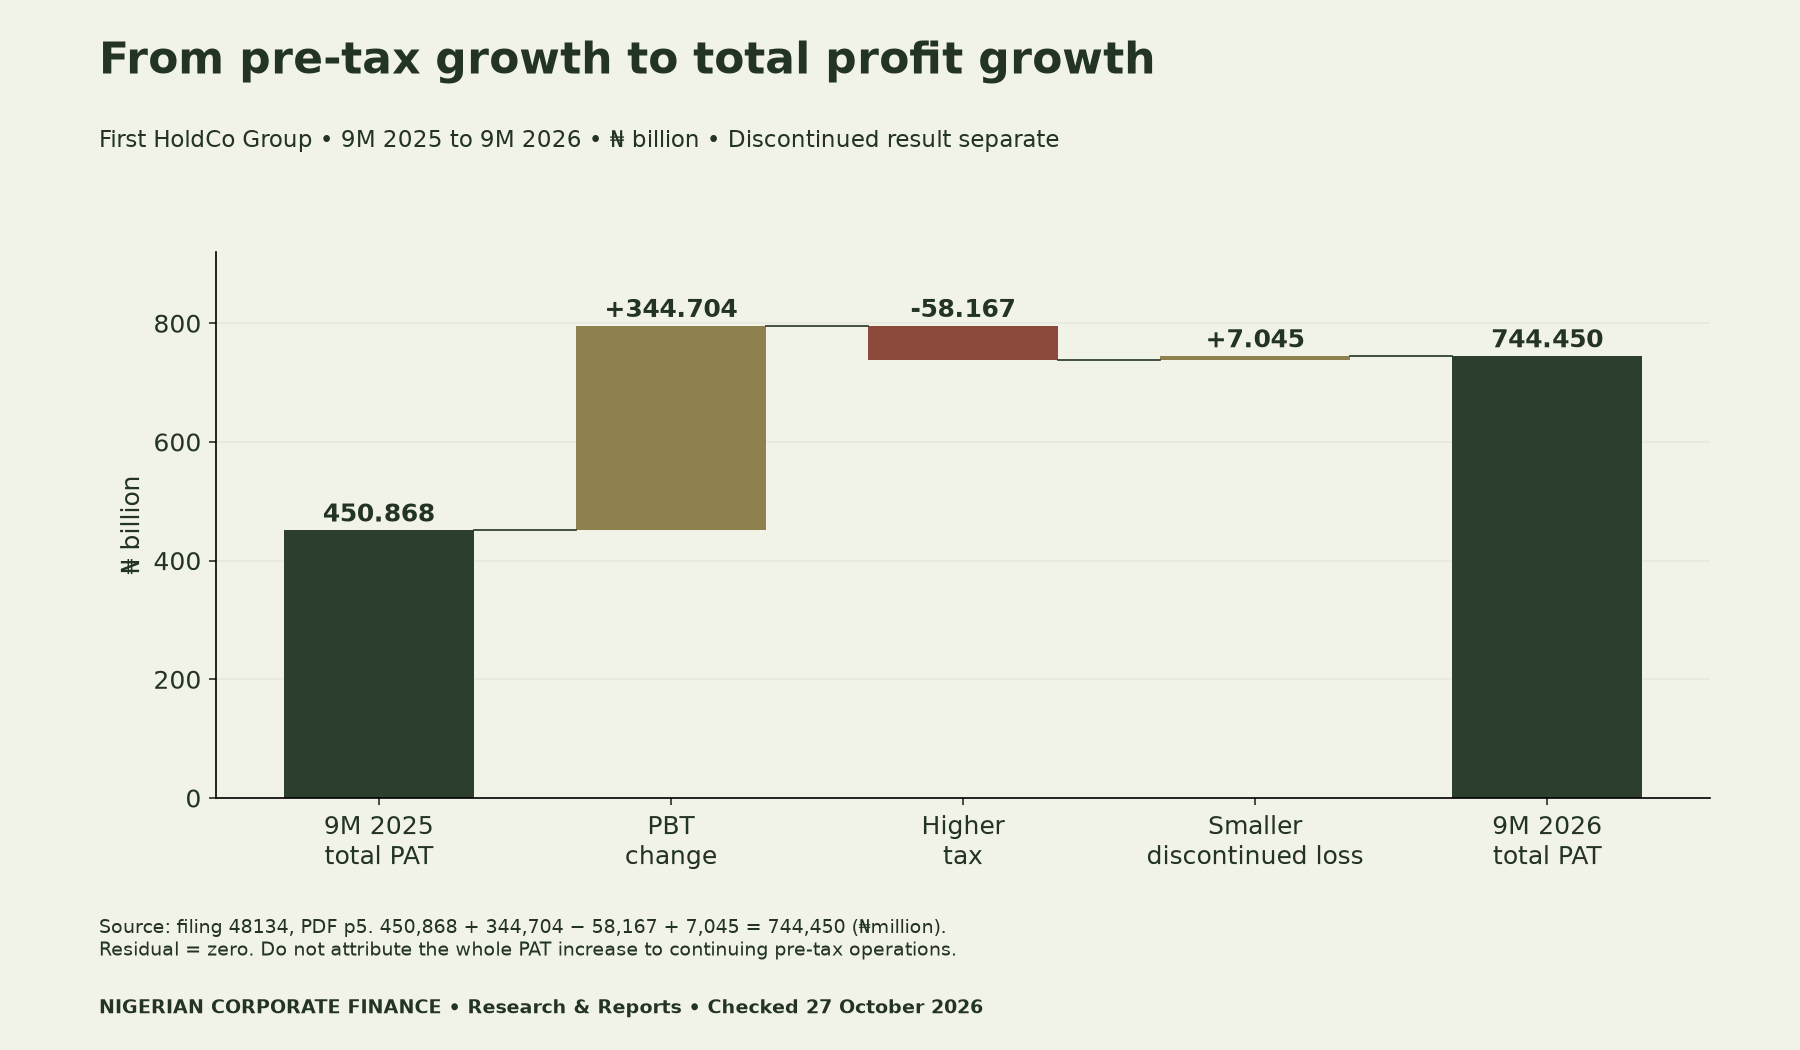
In original units, 450,868 + 344,704 − 58,167 + 7,045 = 744,450, all in naira millions. The residual is zero. Continuing after-tax profit is ₦744.612bn in 2026; the total becomes ₦744.450bn after the discontinued loss. Keeping both labels visible avoids overstating a continuing-operations conclusion.
Questions for a finance or credit committee
First, document the accounting basis for each earnings stream. Then identify the cash evidence and the historical range of outcomes. Finally, state the assumption required to carry that stream into a forecast. An exact reconciliation is a necessary starting point, but it is not proof of sustainability.
For net interest income, request a comparable volume, yield and funding-cost bridge. For fees, distinguish the service mix and related expenses. Ask for separate evidence on recovery vintages, instrument exposures and impairment assumptions. Expense forecasts also need their own timing and cost-base evidence.
The downloadable review worksheet leaves those judgments open for the reader to document. It contains no prefilled recurrence ratings or invented target earnings. Our NGX Group quarterly-versus-cumulative margin study covers a related period-control question. The Unilever funding analysis illustrates why earnings and cash resources need separate reviews.
Methods, filing version and downloads
We transcribed the complete Group pre-tax income-statement components and the supporting Note 10 and Note 12 details. Signed income and expense movements feed the bridge. Nine component, total and note checks reconcile to zero; the separate PAT-movement check also passes. Percentage changes use current ÷ prior − 1, and presentation rounding follows the exact calculations.
Two official files are retained in our source archive. Filing 48133 states a 21 October approval date, while filing 48134 states 23 October. This report explicitly uses 48134 and its source pages. The figures used here were checked against that file; no claim about the reason for the date difference is made.
These interim accounts do not establish future recurrence, underlying asset quality or collection performance by themselves. We make no independent audit finding, credit rating or investment recommendation. Stronger credit conclusions require broader evidence and appropriate professional review.
Download the First HoldCo earnings-bridge data (CSV), including the 12 signed pre-tax components, tax/PAT layer and supporting-note details. The bridge-level field identifies non-additive detail rows.
Use the earnings-driver review worksheet (CSV) to document accounting basis, cash evidence, historical variability and forecast assumptions for seven streams. Blank fields are intentional.
Suggested citation: Nigerian Corporate Finance (27 October 2026), “First HoldCo 9M 2026: Building an Earnings Bridge Beyond Net Interest Income,” calculations from First HoldCo Plc unaudited Group statements, NGX filing 48134, PDF pages 5, 32–33.


