




The NGX Group Q3 2026 operating margin fell even as the nine-month margin improved. Using operating profit divided by total income, our calculations show a fall from 54.5% to 41.5% for July–September. However, the January–September ratio rose from 47.7% to 50.3%. Both findings come from the same unaudited filing.
For a finance team, the lesson is practical: a cumulative scorecard and a recent-quarter review answer different questions. This report reconstructs the quarterly profit change, keeps the reporting periods separate and supplies a reusable review worksheet. It makes no share-price forecast or recommendation to trade securities.
Research checked on 27 October 2026. The board authorised the accounts on 20 October. The issuer’s download page records publication on 23 October. These observations end on 30 September; they are not October trading results.
NGX Group Q3 2026 operating margin: the period matters
Page 4 of the primary financial statements presents discrete Q3 and cumulative nine-month columns. Each also has Group and parent Company figures. We use the consolidated Group throughout. Mixing a Company result with Group income would create a different, invalid ratio.
Total income combines revenue and other income. Our margin is therefore operating profit ÷ total income × 100. Revenue alone is not an interchangeable denominator. The distinction also helps readers understand why a revenue-growth headline cannot settle a margin question.
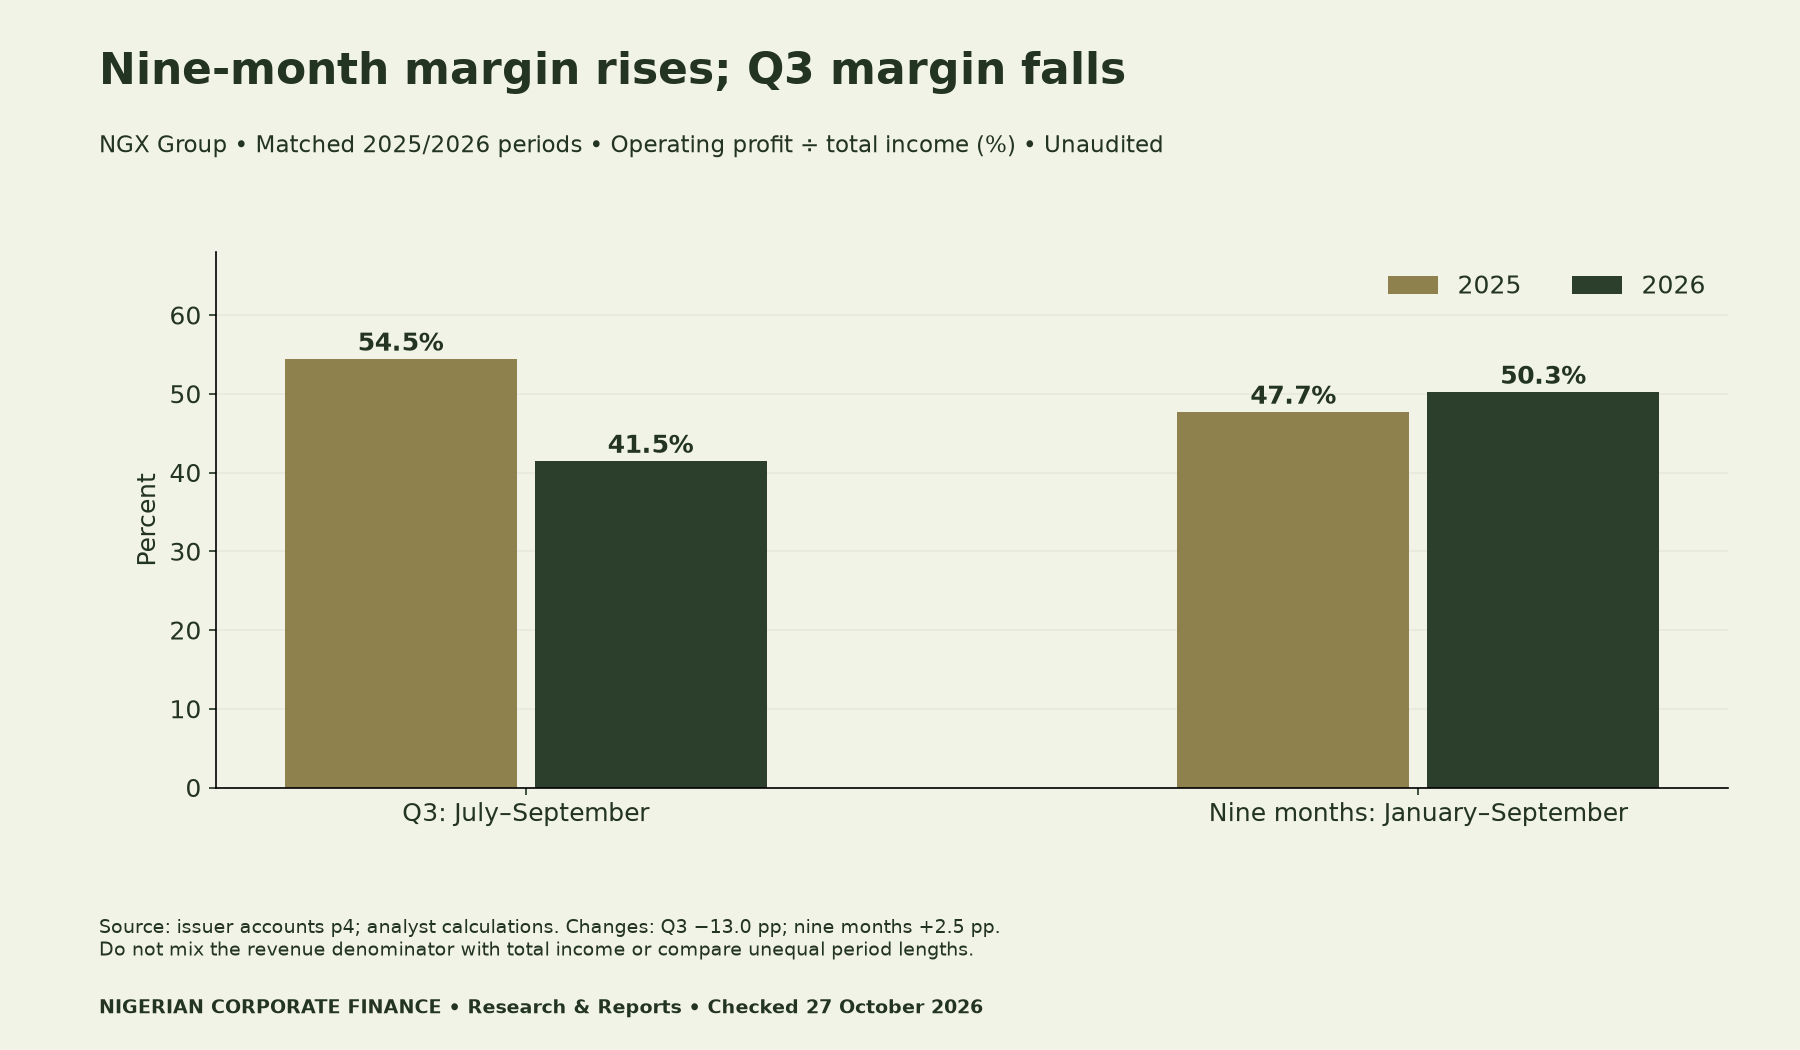
The quarterly fall is 13.0 percentage points, rounded from the unrounded ratios. The nine-month rise is 2.5 percentage points. These are percentage-point changes, rather than percentage changes in the margin. Neither series is annualised, and the nine-month observation already includes Q3.
Revenue grew, but the expense increase was larger
Q3 revenue rose from ₦7.084bn to ₦9.661bn, a calculated increase of 36.4%. Total operating expenses rose from ₦3.682bn to ₦5.987bn, or 62.6%. Meanwhile, other income fell from ₦1.003bn to ₦0.574bn. Operating profit consequently fell from ₦4.405bn to ₦4.248bn, a decline of 3.6%.
| Group measure (₦bn) | Q3 2025 | Q3 2026 | 9M 2025 | 9M 2026 |
|---|---|---|---|---|
| Revenue | 7.084 | 9.661 | 15.162 | 27.261 |
| Other income | 1.003 | 0.574 | 2.784 | 2.312 |
| Total income | 8.087 | 10.235 | 17.947 | 29.573 |
| Total operating expenses | 3.682 | 5.987 | 9.380 | 14.708 |
| Operating profit | 4.405 | 4.248 | 8.567 | 14.865 |
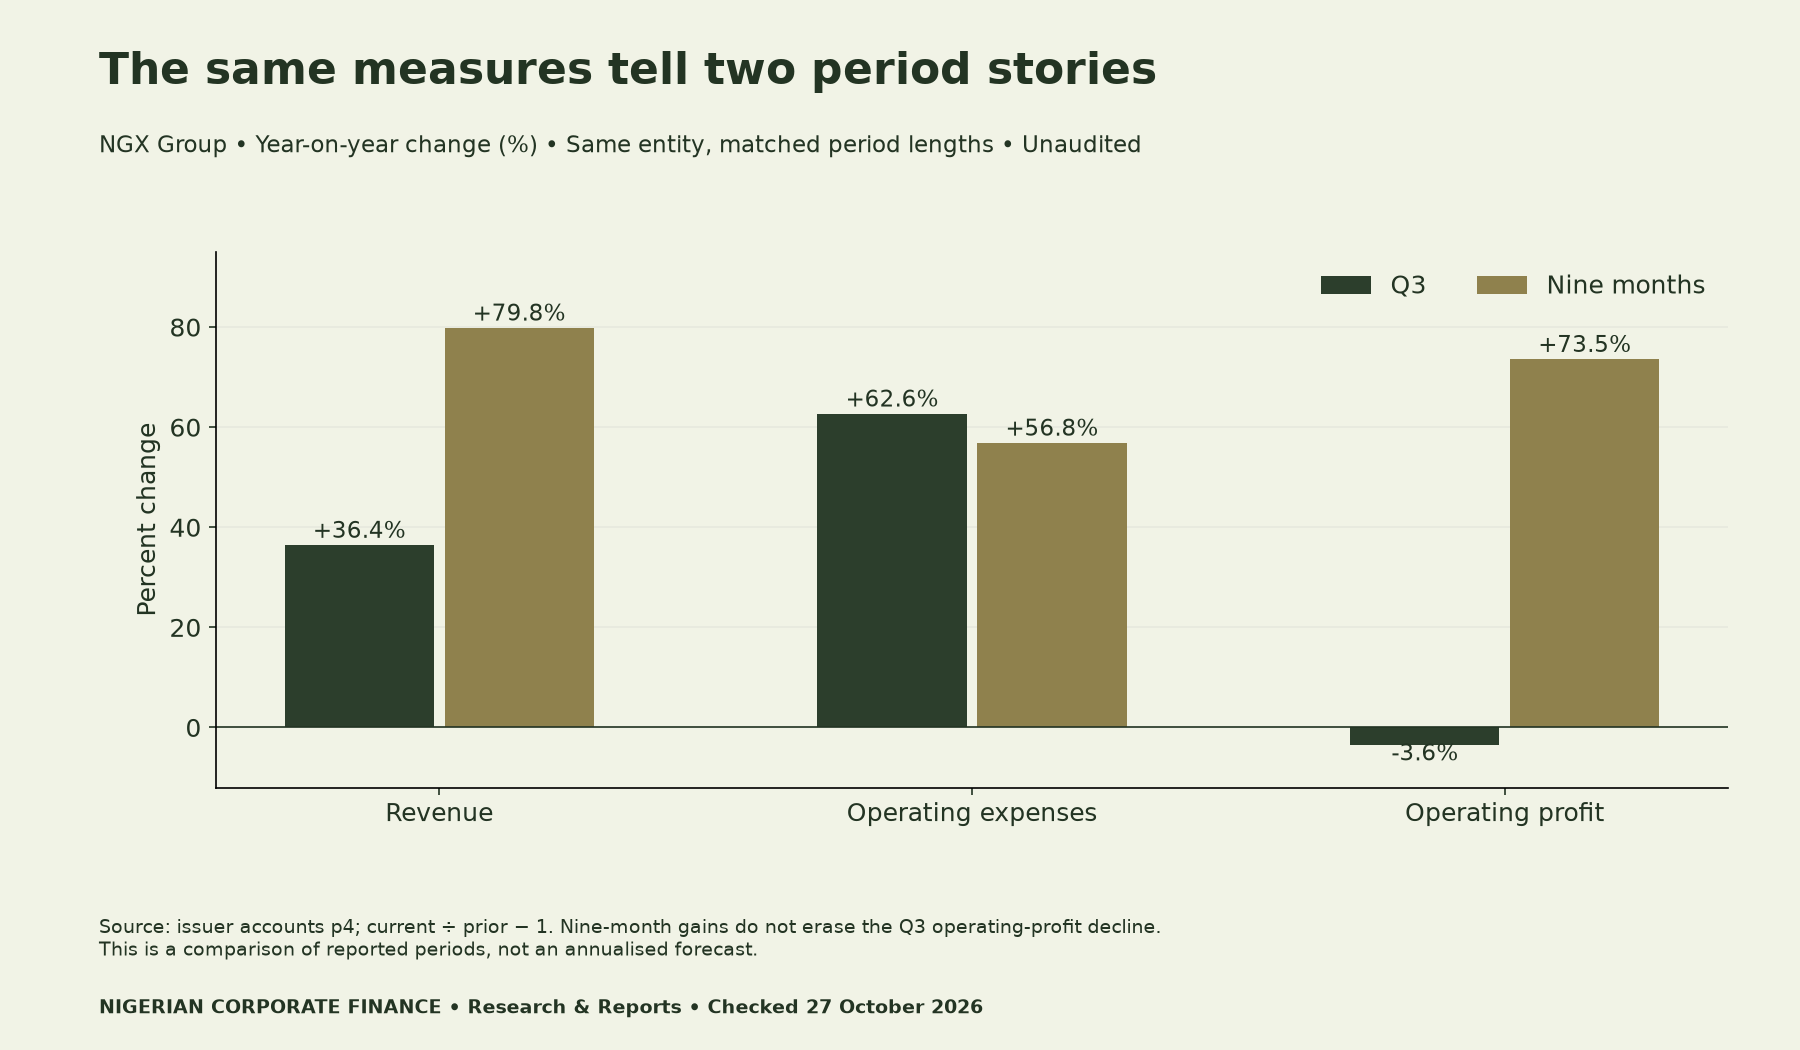
The nine-month figures tell a stronger cumulative story: revenue grew 79.8%, operating expenses 56.8% and operating profit 73.5%. Those results remain valid. However, they do not remove the need to investigate the latest quarter. A budget review should show both matched comparisons before selecting an explanation.
An exact bridge from last year’s quarterly profit
We start with Q3 2025 operating profit and apply every income and operating-expense movement shown on page 4. Revenue contributes +₦2.577bn. Lower other income contributes −₦0.429bn. Higher personnel costs, other operating expenses and depreciation/amortisation contribute −₦1.745bn, −₦0.494bn and −₦0.066bn, respectively.
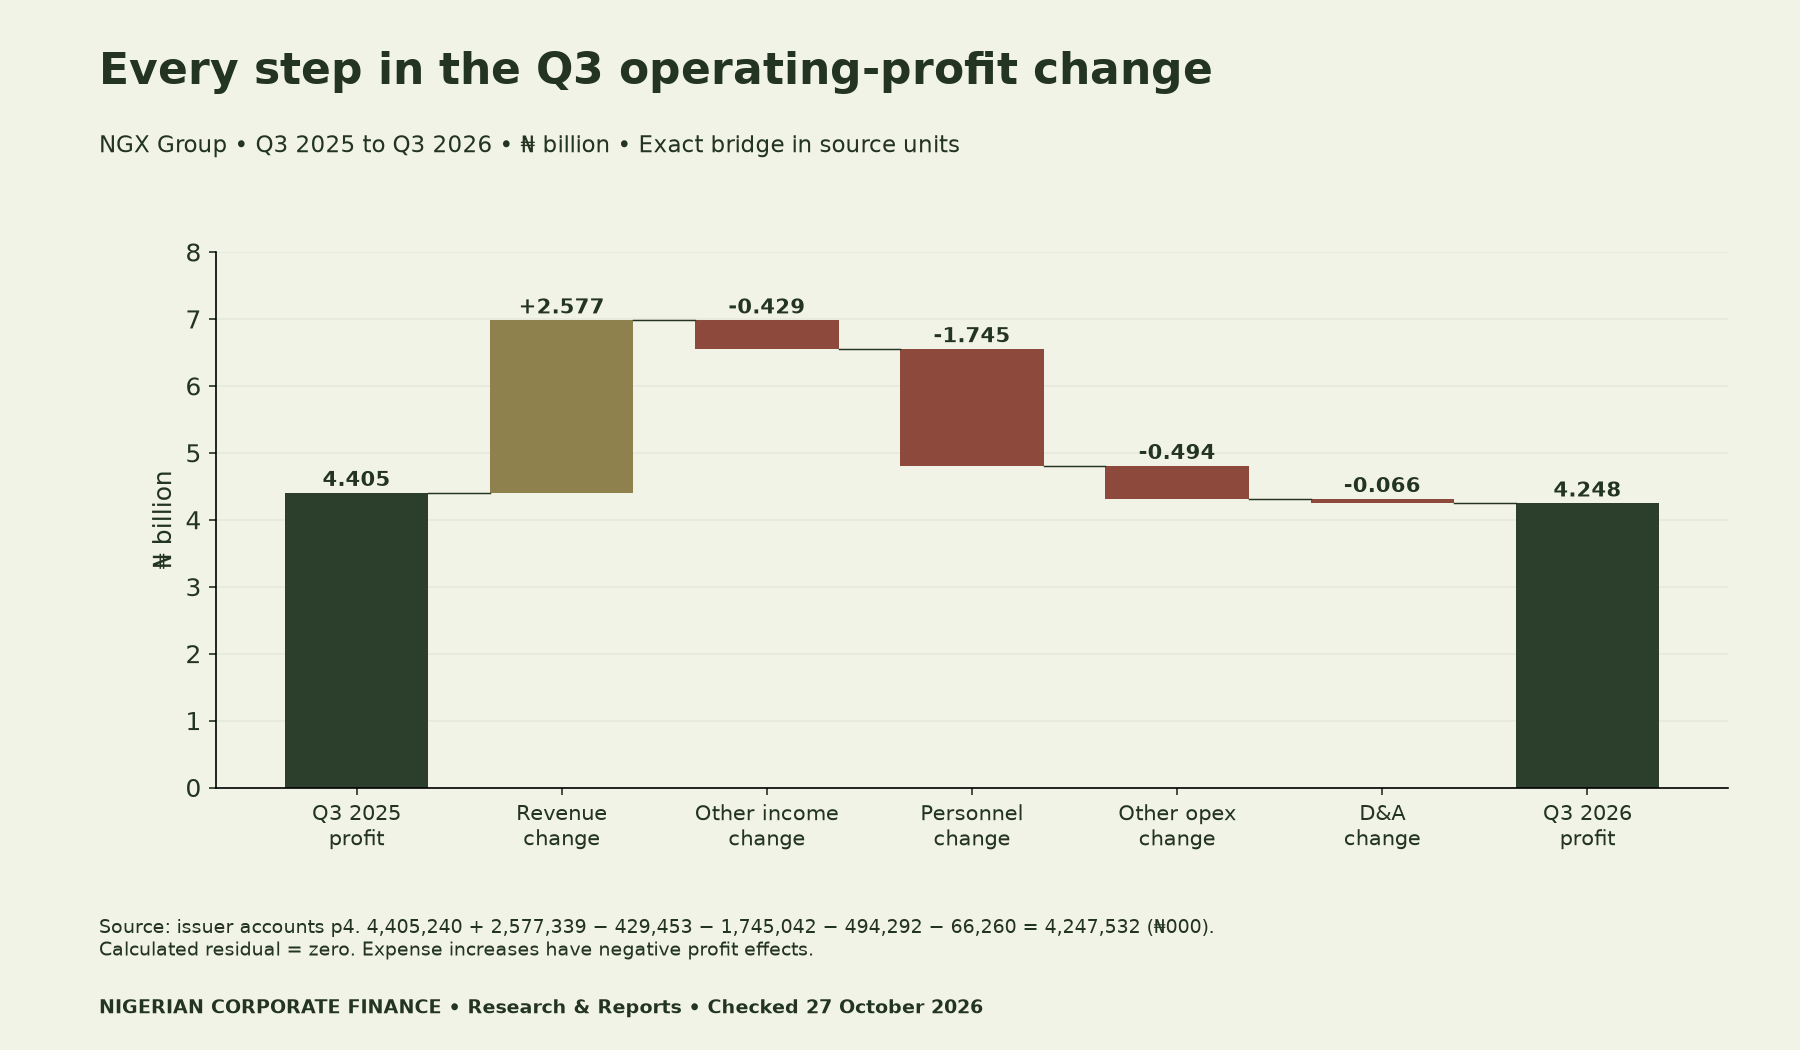
The calculation reconciles exactly at the filing’s original precision: 4,405,240 + 2,577,339 − 429,453 − 1,745,042 − 494,292 − 66,260 = 4,247,532, all in naira thousands. The residual is zero. Rounded chart labels are for reading; the download retains the exact inputs.
This is arithmetic attribution. It identifies which reported movements changed operating profit, but it does not establish management’s motivation, the cash payment date or the future run rate. For a complementary definition-control case, see our Transcorp Power cash reconciliation.
What the cost notes establish—and what they leave open
Personnel costs account for 75.7% of the ₦2.306bn quarterly operating-expense increase. Note 6 separates salaries and other staff benefits from the defined contribution plan. Salaries and benefits rose from ₦1.577bn to ₦3.318bn; the plan charge rose from ₦0.055bn to ₦0.059bn. Thus, almost all the personnel variance sits in the first line.
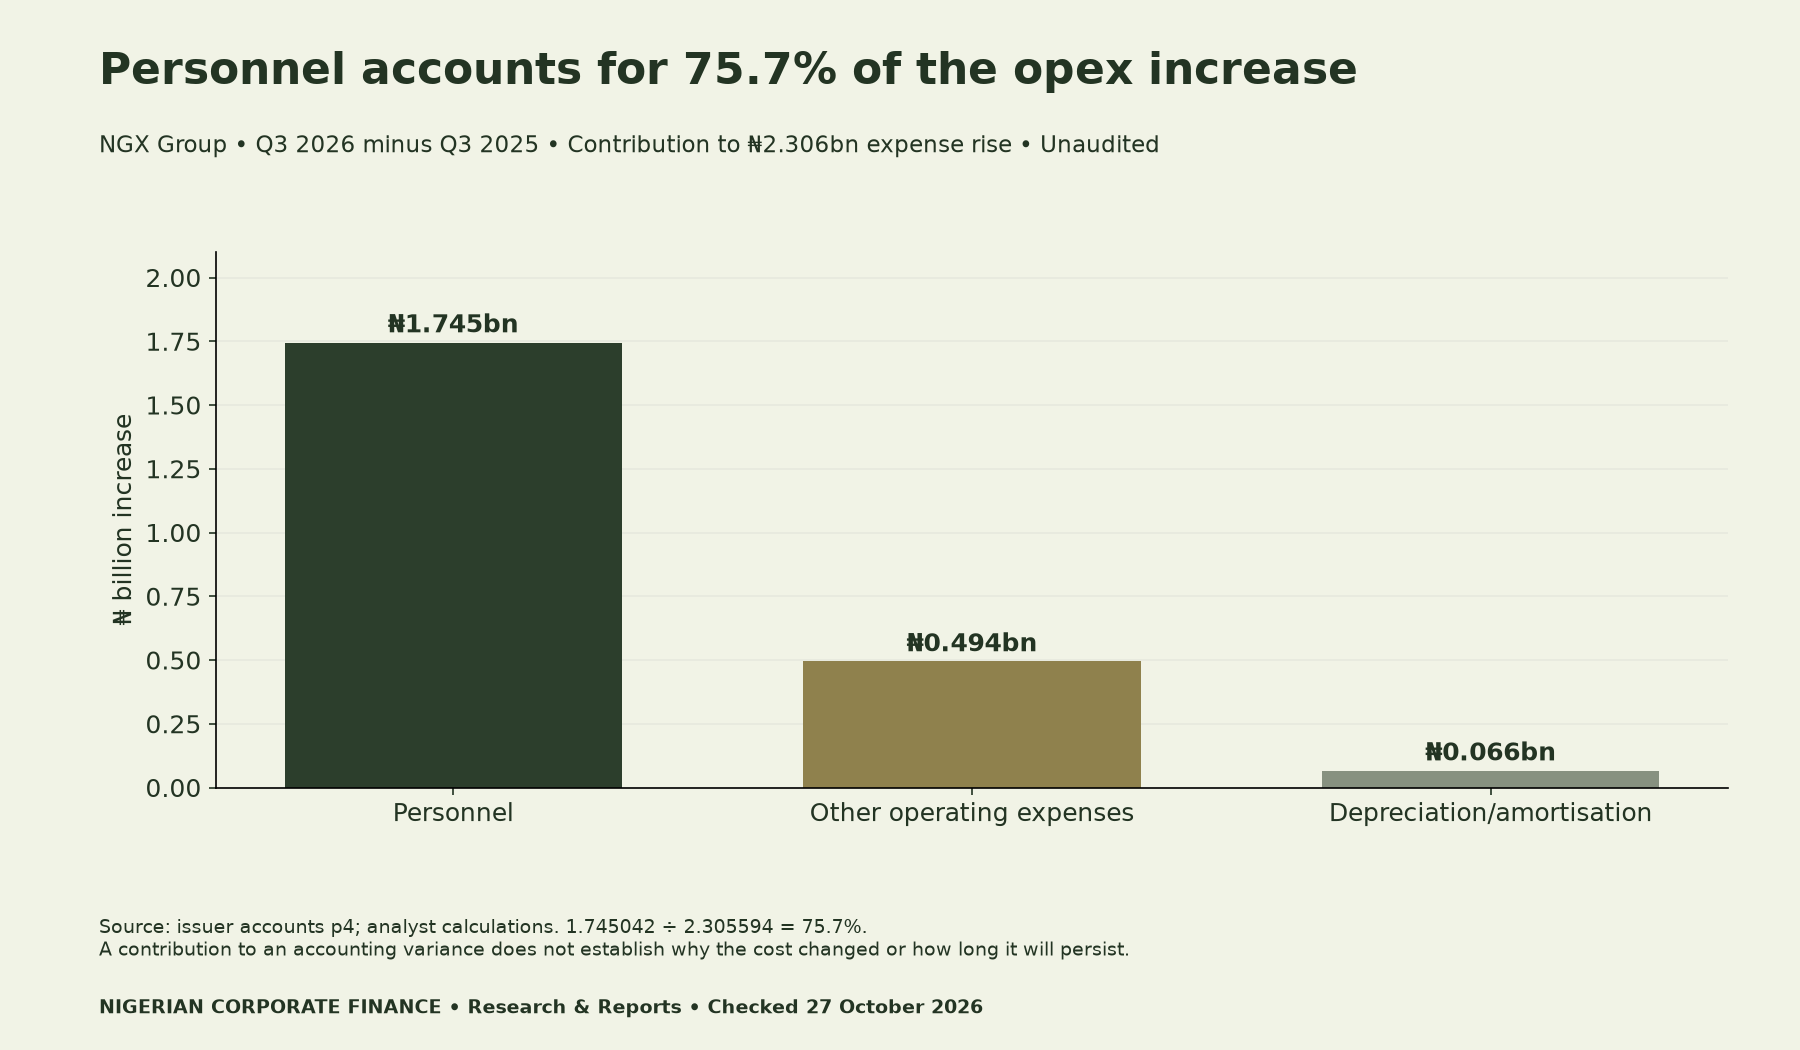
Nevertheless, the note does not split that movement into headcount, pay changes, bonuses, severance or timing adjustments. We cannot label it permanently recurring from this disclosure alone. A planning team should request that split and compare the recognition period with its approved budget.
Note 7 also shows offsetting movements. General expenses rose from ₦29.012m to ₦564.618m, while business development fell from ₦625.035m to ₦185.860m. Technology cost fell from ₦543.362m to ₦511.261m. These examples caution against describing the entire increase as technology investment or broad inflation without further evidence.

Keep operating profit separate from final profit
Q3 pre-tax profit increased slightly, from ₦5.767bn to ₦5.825bn, even though operating profit fell. The filing reports no 2026 Q3 finance cost, versus ₦206.879m in Q3 2025. The investee-profit contribution also rose slightly, from ₦1.569bn to ₦1.578bn.
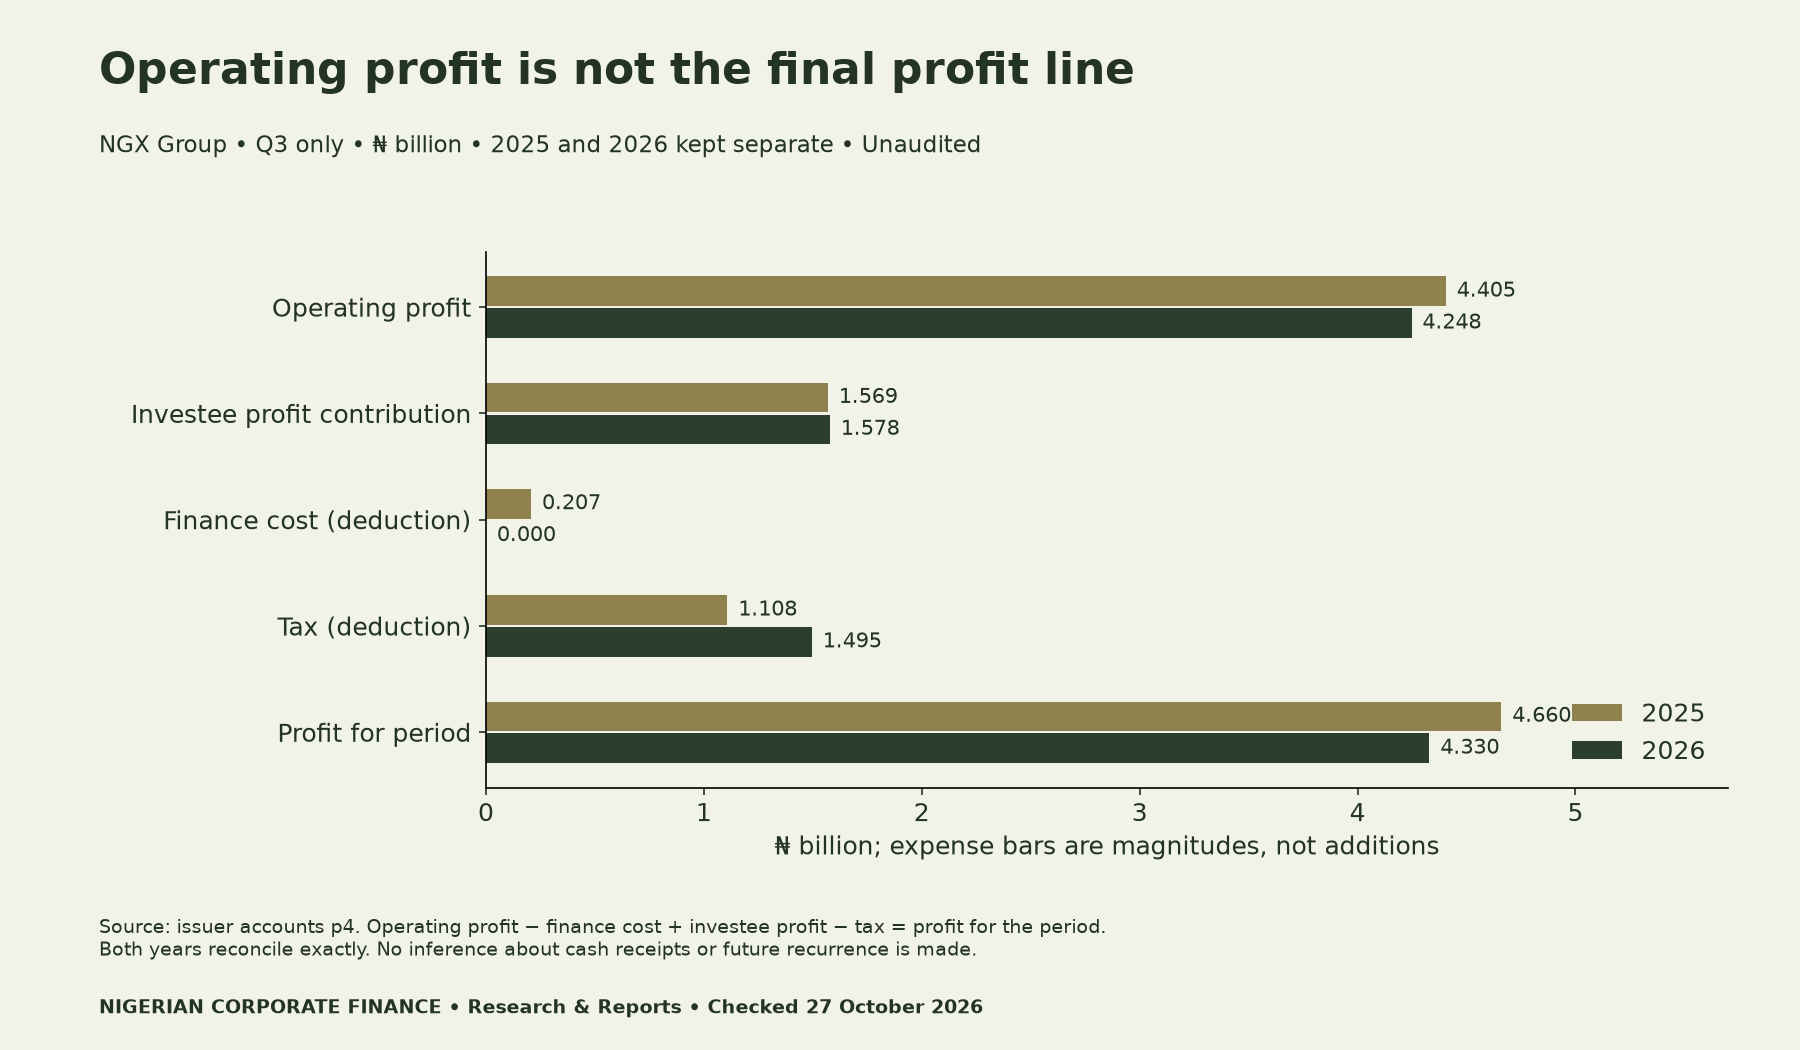
After tax, quarterly profit fell from ₦4.660bn to ₦4.330bn. The tax charge rose from ₦1.108bn to ₦1.495bn. Each layer therefore needs its own explanation. Investee accounting profit is not automatically a cash receipt, and a lower financing charge is not evidence that operating costs improved.
A budget-review process that preserves the evidence
First, fix the entity, start and end dates, currency, units and period basis before entering values. Next, reconcile income less operating expenses. Then separate the reported variance from hypotheses about its cause. Give each unresolved question an evidence owner and review date.
For personnel, ask for the pay, headcount and timing bridge. For general expenses, seek the supporting categories and recognition dates. Finally, separate transaction activity, contractual fees and valuation-sensitive items within revenue and other income. Use comparable prior quarters before claiming seasonality. A forecast should have explicit assumptions for each stream, rather than extending one quarter mechanically.
Our guide to automated financial controls in Nigeria provides related process context. The Unilever dividend-funding case addresses a separate question: why accounting profit and available funding must not be treated as the same measure.
Methods, limitations and reusable downloads
We transcribed 13 reported measures across four Group columns: Q3 2026, Q3 2025, nine months 2026 and nine months 2025. Changes equal current ÷ prior − 1. Expense amounts are positive in the source CSV; the profit bridge applies negative signs to expense increases. Twenty income, expense, operating-profit, pre-tax and after-tax checks reconcile exactly.
The accounts are unaudited interim statements. One quarter cannot prove permanent deterioration, and the public notes do not supply a reliable fixed/variable cost split. We therefore calculate no break-even point, operating-leverage estimate or subjective earnings score. Subsequent issuer corrections could change the analysis; retain the filing version and rerun the checks before updating it.
Download the exact NGX Group period-comparison data (CSV), with 52 data rows, original units, entity, period basis and source page. It supports all five figures and the reconciliation checks.
Use the blank budget-period review worksheet (CSV) to record your own evidence. Its example row is intentionally unfilled; it is not a forecast for NGX Group.
Suggested citation: Nigerian Corporate Finance (27 October 2026), “NGX Group Q3 2026: Why Strong Nine-Month Growth Can Hide Quarterly Cost Pressure,” calculations from Nigerian Exchange Group Plc’s unaudited statements for the period ended 30 September 2026, pages 3–4 and notes 4–7.


